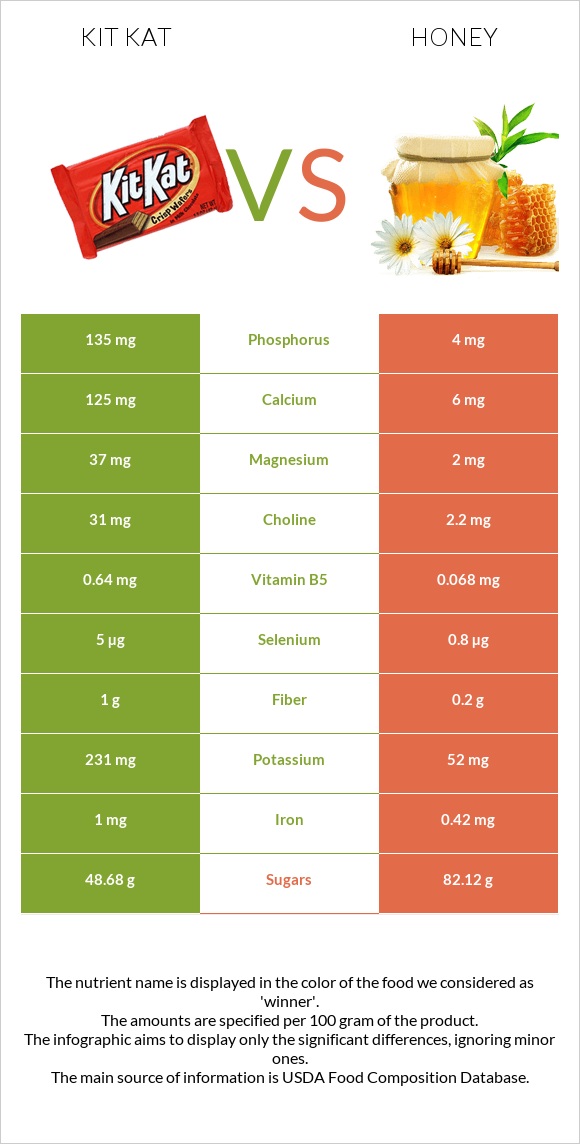
A recap on the differences between kit Kat and honey Kit Kat is higher than honey in vitamin B12, copper, phosphorus, vitamin B2, calcium, vitamin B5, vitamin B1, magnesium, and selenium. Kit Kat covers your daily saturated fat needs 90% more than honey. The amount of saturated fat in honey is lower. The glycemic index of kit Kat is lower. Food varieties used in this article are Candies, KIT KAT Wafer Bar and Honey .
Infographic
Mineral Comparison
Mineral comparison score is based on the number of minerals by which one or the other food is richer. The "coverage" charts below show how much of the daily needs can be covered by 300 grams of the food.
8
100 g
300 g
1 bar, miniature (.35 oz) - 10g 1 bar (1.5 oz) - 42g 1 bar (1.625 oz) - 46g 1 bar (2.8 oz) - 78g 1 bar (3.375 oz) - 96g
Magnesium
Magnesium
Calcium
Calcium
Potassium
Potassium
Iron
Iron
Copper
Copper
Zinc
Zinc
Phosphorus
Phosphorus
Sodium
Sodium
Manganese
Manganese
Selenium
Selenium
26%
38%
20%
38%
73%
2.5%
58%
7%
13%
27%
2
100 g
300 g
1 packet (0.5 oz) - 14g 1 tbsp - 21g 1 cup - 339g
Magnesium
Magnesium
Calcium
Calcium
Potassium
Potassium
Iron
Iron
Copper
Copper
Zinc
Zinc
Phosphorus
Phosphorus
Sodium
Sodium
Manganese
Manganese
Selenium
Selenium
1.4%
1.8%
4.6%
16%
12%
6%
1.7%
0.52%
10%
4.4%
Vitamin Comparison
Vitamin comparison score is based on the number of vitamins by which one or the other food is richer. The "coverage" charts below show how much of the daily needs can be covered by 300 grams of the food.
9
100 g
300 g
1 bar, miniature (.35 oz) - 10g 1 bar (1.5 oz) - 42g 1 bar (1.625 oz) - 46g 1 bar (2.8 oz) - 78g 1 bar (3.375 oz) - 96g
Vitamin C
Vit. C
Vitamin D
Vit. D
Vitamin A
Vit. A
Vitamin E
Vit. E
Vitamin B1
Vit. B1
Vitamin B2
Vit. B2
Vitamin B3
Vit. B3
Vitamin B5
Vit. B5
Vitamin B6
Vit. B6
Vitamin B12
Vit. B12
Vitamin K
Vit. K
Folate
Folate
0%
0%
8%
6.8%
29%
48%
9.4%
38%
4.6%
70%
13%
11%
2
100 g
300 g
1 packet (0.5 oz) - 14g 1 tbsp - 21g 1 cup - 339g
Vitamin C
Vit. C
Vitamin D
Vit. D
Vitamin A
Vit. A
Vitamin E
Vit. E
Vitamin B1
Vit. B1
Vitamin B2
Vit. B2
Vitamin B3
Vit. B3
Vitamin B5
Vit. B5
Vitamin B6
Vit. B6
Vitamin B12
Vit. B12
Vitamin K
Vit. K
Folate
Folate
1.7%
0%
0%
0%
0%
8.8%
2.3%
4.1%
5.5%
0%
0%
1.5%
All nutrients comparison - raw data values
Nutrient
DV% diff.
Saturated fat
17.953g
0g
82%
Fructose
0.2g
40.94g
51%
Fats
25.99g
0g
40%
Vitamin B12
0.56µg
0µg
23%
Copper
0.22mg
0.036mg
20%
Phosphorus
135mg
4mg
19%
Monounsaturated fat
5.844g
0g
15%
Vitamin B2
0.21mg
0.038mg
13%
Protein
6.51g
0.3g
12%
Calcium
125mg
6mg
12%
Calories
518kcal
304kcal
11%
Vitamin B5
0.64mg
0.068mg
11%
Vitamin B1
0.117mg
0mg
10%
Magnesium
37mg
2mg
8%
Selenium
5µg
0.8µg
8%
Iron
1mg
0.42mg
7%
Carbs
64.59g
82.4g
6%
Polyunsaturated fat
0.895g
0g
6%
Potassium
231mg
52mg
5%
Choline
31mg
2.2mg
5%
Cholesterol
11mg
0mg
4%
Starch
10.6g
4%
Vitamin K
5.2µg
0µg
4%
Caffeine
14mg
0mg
4%
Fiber
1g
0.2g
3%
Vitamin A
24µg
0µg
3%
Folate
14µg
2µg
3%
Sodium
54mg
4mg
2%
Vitamin E
0.34mg
0mg
2%
Vitamin B3
0.5mg
0.121mg
2%
Vitamin C
0mg
0.5mg
1%
Zinc
0.09mg
0.22mg
1%
Manganese
0.1mg
0.08mg
1%
Protein per 100 calories
1.3g
0.1g
N/A
Calories per 10 g protein
796kcal
10133kcal
N/A
Weight per 100 calories
19g
33g
N/A
Unsaturated / Saturated Fat ratio
0.38
N/A
Net carbs
63.59g
82.2g
N/A
Sugar
48.68g
82.12g
N/A
Vitamin B6
0.02mg
0.024mg
0%
Trans fat
0.099g
N/A
Tryptophan
0.09mg
0.004mg
0%
Threonine
0.19mg
0.004mg
0%
Isoleucine
0.28mg
0.008mg
0%
Leucine
0.52mg
0.01mg
0%
Lysine
0.28mg
0.008mg
0%
Methionine
0.16mg
0.001mg
0%
Phenylalanine
0.27mg
0.011mg
0%
Valine
0.36mg
0.009mg
0%
Histidine
0.11mg
0.001mg
0%
Omega-3 - ALA
0.075g
N/A
Macronutrient Comparison
Macronutrient breakdown side-by-side comparison
3
7%
26%
65%
Protein:
6.51 g
Fats:
25.99 g
Carbs:
64.59 g
Water:
1.63 g
Other:
1.28 g
2
82%
17%
Protein:
0.3 g
Fats:
0 g
Carbs:
82.4 g
Water:
17.1 g
Other:
0.2 g
Contains
more
Protein Protein
+2070%
Contains
more
Fats Fats
+∞%
Contains
more
Other Other
+540%
Contains
more
Carbs Carbs
+27.6%
Contains
more
Water Water
+949.1%
Carbohydrate type comparison
Carbohydrate type breakdown side-by-side comparison
3
18%
68%
14%
Starch:
10.6 g
Sucrose:
40.04 g
Glucose:
0.16 g
Fructose:
0.2 g
Lactose:
8.21 g
Maltose:
0.07 g
Galactose:
0 g
4
44%
50%
2%
4%
Starch:
0 g
Sucrose:
0.89 g
Glucose:
35.75 g
Fructose:
40.94 g
Lactose:
0 g
Maltose:
1.44 g
Galactose:
3.1 g
Contains
more
Starch Starch
+∞%
Contains
more
Sucrose Sucrose
+4398.9%
Contains
more
Lactose Lactose
+∞%
Contains
more
Glucose Glucose
+22243.8%
Contains
more
Fructose Fructose
+20370%
Contains
more
Maltose Maltose
+1957.1%
Contains
more
Galactose Galactose
+∞%