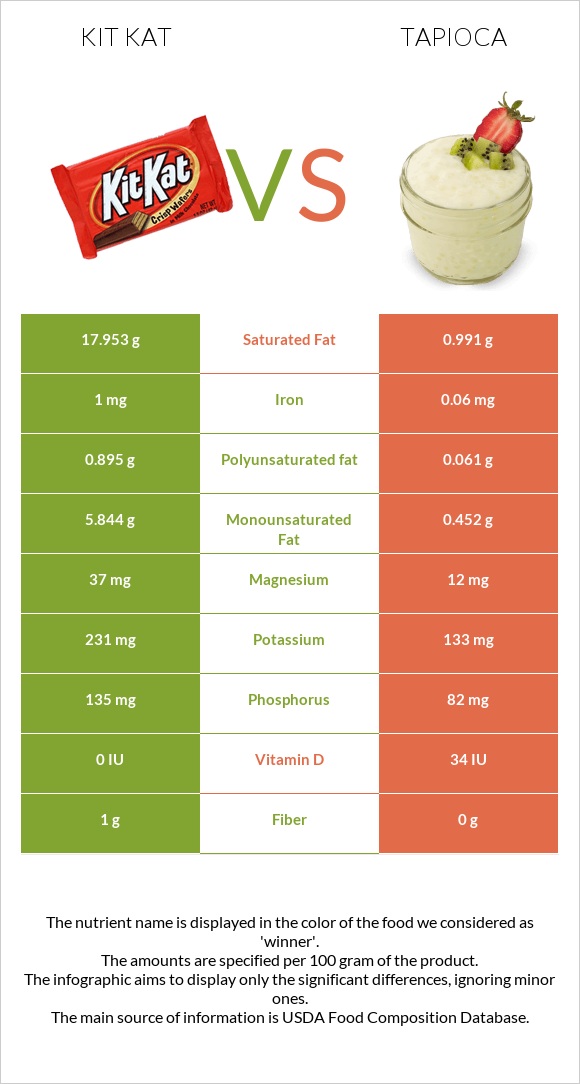
How are kit Kat and tapioca different? Tapioca contains less copper, vitamin B12, iron, phosphorus, vitamin B5, vitamin B1, magnesium, selenium, and vitamin B2 than kit Kat. Kit Kat covers your daily need for saturated fat, 85% more than tapioca. Kit Kat has 18 times more copper than tapioca. Kit Kat has 0.22mg of copper, while tapioca has 0.012mg. Tapioca contains less saturated fat. Tapioca has a higher glycemic index. The glycemic index of tapioca is 78, while the glycemic index of kit Kat is 50. Candies, KIT KAT Wafer Bar and Puddings, tapioca, dry mix, prepared with 2% milk types were used in this article.
Infographic
Mineral Comparison
Mineral comparison score is based on the number of minerals by which one or the other food is richer. The "coverage" charts below show how much of the daily needs can be covered by 300 grams of the food.
9
100 g
300 g
1 bar, miniature (.35 oz) - 10g 1 bar (1.5 oz) - 42g 1 bar (1.625 oz) - 46g 1 bar (2.8 oz) - 78g 1 bar (3.375 oz) - 96g
Magnesium
Magnesium
Calcium
Calcium
Potassium
Potassium
Iron
Iron
Copper
Copper
Zinc
Zinc
Phosphorus
Phosphorus
Sodium
Sodium
Manganese
Manganese
Selenium
Selenium
26%
38%
20%
38%
73%
2.5%
58%
7%
13%
27%
1
100 g
300 g
0.5 cup - 128g
Magnesium
Magnesium
Calcium
Calcium
Potassium
Potassium
Iron
Iron
Copper
Copper
Zinc
Zinc
Phosphorus
Phosphorus
Sodium
Sodium
Manganese
Manganese
Selenium
Selenium
8.6%
32%
12%
2.3%
4%
9.5%
35%
16%
0.91%
11%
Vitamin Comparison
Vitamin comparison score is based on the number of vitamins by which one or the other food is richer. The "coverage" charts below show how much of the daily needs can be covered by 300 grams of the food.
8
100 g
300 g
1 bar, miniature (.35 oz) - 10g 1 bar (1.5 oz) - 42g 1 bar (1.625 oz) - 46g 1 bar (2.8 oz) - 78g 1 bar (3.375 oz) - 96g
Vitamin C
Vit. C
Vitamin D
Vit. D
Vitamin A
Vit. A
Vitamin E
Vit. E
Vitamin B1
Vit. B1
Vitamin B2
Vit. B2
Vitamin B3
Vit. B3
Vitamin B5
Vit. B5
Vitamin B6
Vit. B6
Vitamin B12
Vit. B12
Vitamin K
Vit. K
Folate
Folate
0%
0%
8%
6.8%
29%
48%
9.4%
38%
4.6%
70%
13%
11%
4
100 g
300 g
0.5 cup - 128g
Vitamin C
Vit. C
Vitamin D
Vit. D
Vitamin A
Vit. A
Vitamin E
Vit. E
Vitamin B1
Vit. B1
Vitamin B2
Vit. B2
Vitamin B3
Vit. B3
Vitamin B5
Vit. B5
Vitamin B6
Vit. B6
Vitamin B12
Vit. B12
Vitamin K
Vit. K
Folate
Folate
2.3%
14%
16%
0%
7.5%
33%
1.4%
17%
7.6%
31%
0%
3%
All nutrients comparison - raw data values
Nutrient
DV% diff.
Saturated fat
17.953g
0.991g
77%
Fats
25.99g
1.67g
37%
Copper
0.22mg
0.012mg
23%
Calories
518kcal
105kcal
21%
Carbs
64.59g
19.56g
15%
Vitamin B12
0.56µg
0.25µg
13%
Monounsaturated fat
5.844g
0.452g
13%
Iron
1mg
0.06mg
12%
Phosphorus
135mg
82mg
8%
Protein
6.51g
2.88g
7%
Vitamin B1
0.117mg
0.03mg
7%
Vitamin B5
0.64mg
0.277mg
7%
Magnesium
37mg
12mg
6%
Choline
31mg
6%
Polyunsaturated fat
0.895g
0.061g
6%
Vitamin D
0µg
0.9µg
5%
Selenium
5µg
2µg
5%
Vitamin B2
0.21mg
0.143mg
5%
Vitamin D*
0 IU
34 IU
4%
Fiber
1g
0g
4%
Starch
10.6g
4%
Manganese
0.1mg
0.007mg
4%
Vitamin K
5.2µg
4%
Caffeine
14mg
0mg
4%
Potassium
231mg
133mg
3%
Sodium
54mg
121mg
3%
Vitamin A
24µg
47µg
3%
Vitamin B3
0.5mg
0.075mg
3%
Folate
14µg
4µg
3%
Cholesterol
11mg
6mg
2%
Calcium
125mg
105mg
2%
Zinc
0.09mg
0.35mg
2%
Vitamin E
0.34mg
2%
Vitamin C
0mg
0.7mg
1%
Vitamin B6
0.02mg
0.033mg
1%
Protein per 100 calories
1.3g
2.7g
N/A
Calories per 10 g protein
796kcal
365kcal
N/A
Weight per 100 calories
19g
95g
N/A
Unsaturated / Saturated Fat ratio
0.38
0.52
N/A
Net carbs
63.59g
19.56g
N/A
Sugar
48.68g
N/A
Trans fat
0.099g
N/A
Tryptophan
0.09mg
0.041mg
0%
Threonine
0.19mg
0.13mg
0%
Isoleucine
0.28mg
0.173mg
0%
Leucine
0.52mg
0.282mg
0%
Lysine
0.28mg
0.228mg
0%
Methionine
0.16mg
0.073mg
0%
Phenylalanine
0.27mg
0.139mg
0%
Valine
0.36mg
0.192mg
0%
Histidine
0.11mg
0.078mg
0%
Fructose
0.2g
0%
Omega-3 - ALA
0.075g
N/A
Macronutrient Comparison
Macronutrient breakdown side-by-side comparison
4
7%
26%
65%
Protein:
6.51 g
Fats:
25.99 g
Carbs:
64.59 g
Water:
1.63 g
Other:
1.28 g
1
3%
2%
20%
75%
Protein:
2.88 g
Fats:
1.67 g
Carbs:
19.56 g
Water:
75.01 g
Other:
0.88 g
Contains
more
Protein Protein
+126%
Contains
more
Fats Fats
+1456.3%
Contains
more
Carbs Carbs
+230.2%
Contains
more
Other Other
+45.5%
Contains
more
Water Water
+4501.8%
Fat Type Comparison
Fat type breakdown side-by-side comparison
2
73%
24%
4%
Saturated fat:
Sat. Fat
17.953 g
Monounsaturated fat:
Mono. Fat
5.844 g
Polyunsaturated fat:
Poly. Fat
0.895 g
1
66%
30%
4%
Saturated fat:
Sat. Fat
0.991 g
Monounsaturated fat:
Mono. Fat
0.452 g
Polyunsaturated fat:
Poly. Fat
0.061 g
Contains
more
Mono. Fat Monounsaturated fat
+1192.9%
Contains
more
Poly. Fat Polyunsaturated fat
+1367.2%
Contains
less
Sat. Fat Saturated fat
-94.5%