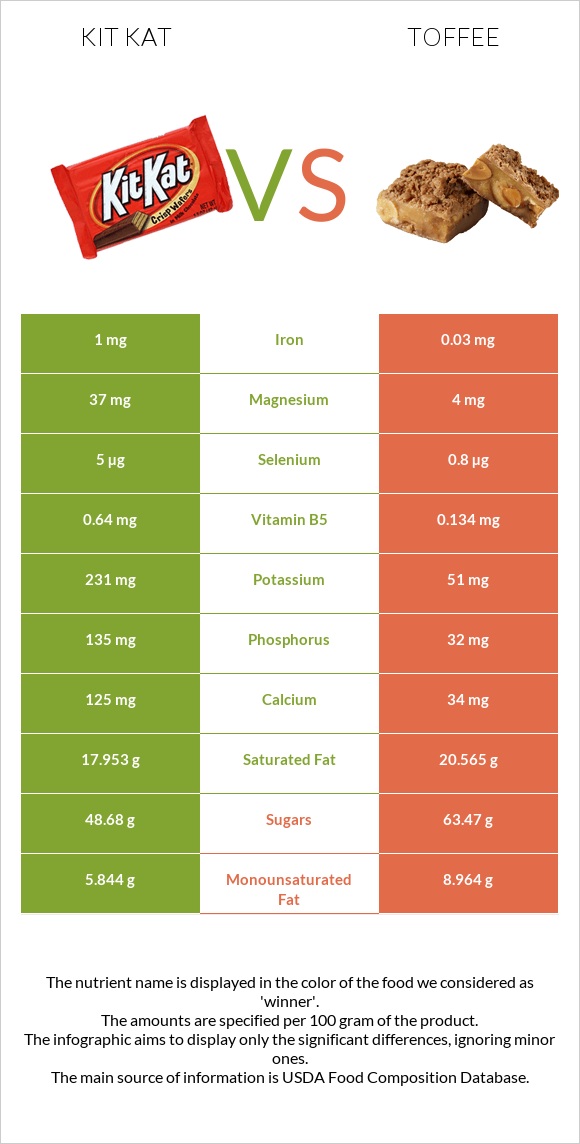
Important differences between kit Kat and toffee Kit Kat has more copper, vitamin B12, phosphorus, iron, vitamin B2, vitamin B5, and calcium; however, toffee has more vitamin A. Toffee's daily need coverage for cholesterol is 31% more. Kit Kat has 73 times more copper than toffee. Kit Kat has 0.22mg of copper, while toffee has 0.003mg. Kit Kat is lower in saturated fat. The food varieties used in the comparison are Candies, KIT KAT Wafer Bar and Candies, toffee, prepared-from-recipe .
Infographic
Mineral Comparison
Mineral comparison score is based on the number of minerals by which one or the other food is richer. The "coverage" charts below show how much of the daily needs can be covered by 300 grams of the food.
9
100 g
300 g
1 bar, miniature (.35 oz) - 10g 1 bar (1.5 oz) - 42g 1 bar (1.625 oz) - 46g 1 bar (2.8 oz) - 78g 1 bar (3.375 oz) - 96g
Magnesium
Magnesium
Calcium
Calcium
Potassium
Potassium
Iron
Iron
Copper
Copper
Zinc
Zinc
Phosphorus
Phosphorus
Sodium
Sodium
Manganese
Manganese
Selenium
Selenium
26%
38%
20%
38%
73%
2.5%
58%
7%
13%
27%
1
100 g
300 g
1 piece - 12g
Magnesium
Magnesium
Calcium
Calcium
Potassium
Potassium
Iron
Iron
Copper
Copper
Zinc
Zinc
Phosphorus
Phosphorus
Sodium
Sodium
Manganese
Manganese
Selenium
Selenium
2.9%
10%
4.5%
1.1%
1%
3.3%
14%
18%
0.26%
4.4%
Vitamin Comparison
Vitamin comparison score is based on the number of vitamins by which one or the other food is richer. The "coverage" charts below show how much of the daily needs can be covered by 300 grams of the food.
8
100 g
300 g
1 bar, miniature (.35 oz) - 10g 1 bar (1.5 oz) - 42g 1 bar (1.625 oz) - 46g 1 bar (2.8 oz) - 78g 1 bar (3.375 oz) - 96g
Vitamin C
Vit. C
Vitamin D
Vit. D
Vitamin A
Vit. A
Vitamin E
Vit. E
Vitamin B1
Vit. B1
Vitamin B2
Vit. B2
Vitamin B3
Vit. B3
Vitamin B5
Vit. B5
Vitamin B6
Vit. B6
Vitamin B12
Vit. B12
Vitamin K
Vit. K
Folate
Folate
0%
0%
8%
6.8%
29%
48%
9.4%
38%
4.6%
70%
13%
11%
3
100 g
300 g
1 piece - 12g
Vitamin C
Vit. C
Vitamin D
Vit. D
Vitamin A
Vit. A
Vitamin E
Vit. E
Vitamin B1
Vit. B1
Vitamin B2
Vit. B2
Vitamin B3
Vit. B3
Vitamin B5
Vit. B5
Vitamin B6
Vit. B6
Vitamin B12
Vit. B12
Vitamin K
Vit. K
Folate
Folate
0.67%
0%
106%
19%
2%
16%
0.54%
8%
2.1%
14%
7%
1.5%
All nutrients comparison - raw data values
Nutrient
DV% diff.
Vitamin A
24µg
319µg
33%
Cholesterol
11mg
104mg
31%
Copper
0.22mg
0.003mg
24%
Vitamin B12
0.56µg
0.11µg
19%
Phosphorus
135mg
32mg
15%
Iron
1mg
0.03mg
12%
Saturated fat
17.953g
20.565g
12%
Protein
6.51g
1.07g
11%
Vitamin B2
0.21mg
0.068mg
11%
Fats
25.99g
32.75g
10%
Vitamin B5
0.64mg
0.134mg
10%
Calcium
125mg
34mg
9%
Vitamin B1
0.117mg
0.008mg
9%
Magnesium
37mg
4mg
8%
Selenium
5µg
0.8µg
8%
Monounsaturated fat
5.844g
8.964g
8%
Choline
31mg
6%
Potassium
231mg
51mg
5%
Fiber
1g
0g
4%
Starch
10.6g
4%
Sodium
54mg
135mg
4%
Vitamin E
0.34mg
0.94mg
4%
Manganese
0.1mg
0.002mg
4%
Caffeine
14mg
0mg
4%
Vitamin B3
0.5mg
0.029mg
3%
Folate
14µg
2µg
3%
Calories
518kcal
560kcal
2%
Vitamin K
5.2µg
2.8µg
2%
Polyunsaturated fat
0.895g
1.222g
2%
Vitamin B6
0.02mg
0.009mg
1%
Protein per 100 calories
1.3g
0.19g
N/A
Calories per 10 g protein
796kcal
5234kcal
N/A
Weight per 100 calories
19g
18g
N/A
Unsaturated / Saturated Fat ratio
0.38
0.5
N/A
Vitamin C
0mg
0.2mg
0%
Net carbs
63.59g
64.72g
N/A
Carbs
64.59g
64.72g
0%
Sugar
48.68g
63.47g
N/A
Zinc
0.09mg
0.12mg
0%
Trans fat
0.099g
0.674g
N/A
Tryptophan
0.09mg
0%
Threonine
0.19mg
0%
Isoleucine
0.28mg
0%
Leucine
0.52mg
0%
Lysine
0.28mg
0%
Methionine
0.16mg
0%
Phenylalanine
0.27mg
0%
Valine
0.36mg
0%
Histidine
0.11mg
0%
Fructose
0.2g
0%
Omega-3 - ALA
0.075g
0.065g
N/A
Omega-6 - Linoleic acid
0.445g
N/A
Macronutrient Comparison
Macronutrient breakdown side-by-side comparison
3
7%
26%
65%
Protein:
6.51 g
Fats:
25.99 g
Carbs:
64.59 g
Water:
1.63 g
Other:
1.28 g
2
33%
65%
Protein:
1.07 g
Fats:
32.75 g
Carbs:
64.72 g
Water:
0.55 g
Other:
0.91 g
Contains
more
Protein Protein
+508.4%
Contains
more
Water Water
+196.4%
Contains
more
Other Other
+40.7%
Contains
more
Fats Fats
+26%
Fat Type Comparison
Fat type breakdown side-by-side comparison
1
73%
24%
4%
Saturated fat:
Sat. Fat
17.953 g
Monounsaturated fat:
Mono. Fat
5.844 g
Polyunsaturated fat:
Poly. Fat
0.895 g
2
67%
29%
4%
Saturated fat:
Sat. Fat
20.565 g
Monounsaturated fat:
Mono. Fat
8.964 g
Polyunsaturated fat:
Poly. Fat
1.222 g
Contains
less
Sat. Fat Saturated fat
-12.7%
Contains
more
Mono. Fat Monounsaturated fat
+53.4%
Contains
more
Poly. Fat Polyunsaturated fat
+36.5%