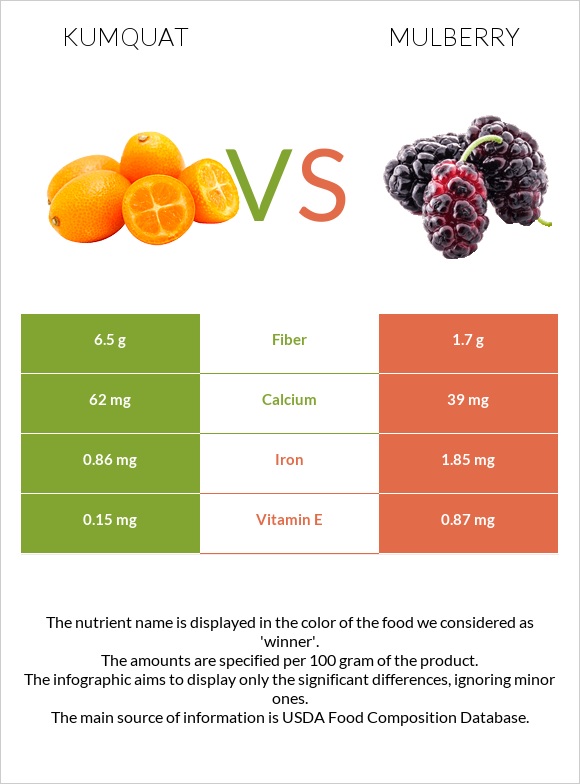
How are kumquat and mulberries different? Kumquat is higher in fiber, vitamin C, and vitamin A; however, mulberries are richer in iron and vitamin K. Daily need coverage for fiber for kumquat is 19% higher. Kumquat contains 12 times more vitamin A than mulberries. While kumquat contains 290 IU of vitamin A, mulberries contain only 25 IU. Mulberries have a lower glycemic index (25) than kumquat (67). Kumquats, raw and Mulberries, raw are the varieties used in this article.
Infographic
Mineral Comparison
Mineral comparison score is based on the number of minerals by which one or the other food is richer. The "coverage" charts below show how much of the daily needs can be covered by 300 grams of the food.
4
100 g
300 g
1 fruit without refuse - 19g
Magnesium
Magnesium
Calcium
Calcium
Potassium
Potassium
Iron
Iron
Copper
Copper
Zinc
Zinc
Phosphorus
Phosphorus
Sodium
Sodium
Manganese
Manganese
Selenium
Selenium
14%
19%
16%
32%
32%
4.6%
8.1%
1.3%
18%
0%
3
100 g
300 g
10 fruit - 15g 1 cup - 140g
Magnesium
Magnesium
Calcium
Calcium
Potassium
Potassium
Iron
Iron
Copper
Copper
Zinc
Zinc
Phosphorus
Phosphorus
Sodium
Sodium
Manganese
Manganese
Selenium
Selenium
13%
12%
17%
69%
20%
3.3%
16%
1.3%
0%
3.3%
Vitamin Comparison
Vitamin comparison score is based on the number of vitamins by which one or the other food is richer. The "coverage" charts below show how much of the daily needs can be covered by 300 grams of the food.
5
100 g
300 g
1 fruit without refuse - 19g
Vitamin C
Vit. C
Vitamin D
Vit. D
Vitamin A
Vit. A
Vitamin E
Vit. E
Vitamin B1
Vit. B1
Vitamin B2
Vit. B2
Vitamin B3
Vit. B3
Vitamin B5
Vit. B5
Vitamin B6
Vit. B6
Vitamin B12
Vit. B12
Vitamin K
Vit. K
Folate
Folate
146%
0%
5%
3%
9.3%
21%
8%
12%
8.3%
0%
0%
13%
5
100 g
300 g
10 fruit - 15g 1 cup - 140g
Vitamin C
Vit. C
Vitamin D
Vit. D
Vitamin A
Vit. A
Vitamin E
Vit. E
Vitamin B1
Vit. B1
Vitamin B2
Vit. B2
Vitamin B3
Vit. B3
Vitamin B5
Vit. B5
Vitamin B6
Vit. B6
Vitamin B12
Vit. B12
Vitamin K
Vit. K
Folate
Folate
121%
0%
0.33%
17%
7.3%
23%
12%
0%
12%
0%
20%
4.5%
All nutrients comparison - raw data values
Nutrient
DV% diff.
Fiber
6.5g
1.7g
19%
Iron
0.86mg
1.85mg
12%
Vitamin C
43.9mg
36.4mg
8%
Vitamin K
0µg
7.8µg
7%
Manganese
0.135mg
6%
Vitamin E
0.15mg
0.87mg
5%
Copper
0.095mg
0.06mg
4%
Vitamin B5
0.208mg
4%
Phosphorus
19mg
38mg
3%
Folate
17µg
6µg
3%
Carbs
15.9g
9.8g
2%
Calcium
62mg
39mg
2%
Vitamin A
15µg
1µg
2%
Calories
71kcal
43kcal
1%
Protein
1.88g
1.44g
1%
Fats
0.86g
0.39g
1%
Selenium
0µg
0.6µg
1%
Vitamin B1
0.037mg
0.029mg
1%
Vitamin B2
0.09mg
0.101mg
1%
Vitamin B3
0.429mg
0.62mg
1%
Vitamin B6
0.036mg
0.05mg
1%
Choline
8.4mg
12.3mg
1%
Protein per 100 calories
2.6g
3.3g
N/A
Calories per 10 g protein
378kcal
299kcal
N/A
Weight per 100 calories
141g
233g
N/A
Net carbs
9.4g
8.1g
N/A
Magnesium
20mg
18mg
0%
Potassium
186mg
194mg
0%
Sugar
9.36g
8.1g
N/A
Zinc
0.17mg
0.12mg
0%
Sodium
10mg
10mg
0%
Saturated fat
0.103g
0.027g
0%
Monounsaturated fat
0.154g
0.041g
0%
Polyunsaturated fat
0.171g
0.207g
0%
Macronutrient Comparison
Macronutrient breakdown side-by-side comparison
3
2%
16%
81%
Protein:
1.88 g
Fats:
0.86 g
Carbs:
15.9 g
Water:
80.85 g
Other:
0.51 g
2
10%
88%
Protein:
1.44 g
Fats:
0.39 g
Carbs:
9.8 g
Water:
87.68 g
Other:
0.69 g
Contains
more
Protein Protein
+30.6%
Contains
more
Fats Fats
+120.5%
Contains
more
Carbs Carbs
+62.2%
Contains
more
Other Other
+35.3%
Fat Type Comparison
Fat type breakdown side-by-side comparison
1
24%
36%
40%
Saturated fat:
Sat. Fat
0.103 g
Monounsaturated fat:
Mono. Fat
0.154 g
Polyunsaturated fat:
Poly. Fat
0.171 g
2
10%
15%
75%
Saturated fat:
Sat. Fat
0.027 g
Monounsaturated fat:
Mono. Fat
0.041 g
Polyunsaturated fat:
Poly. Fat
0.207 g
Contains
more
Mono. Fat Monounsaturated fat
+275.6%
Contains
less
Sat. Fat Saturated fat
-73.8%
Contains
more
Poly. Fat Polyunsaturated fat
+21.1%