Infographic
Mineral Comparison
Mineral comparison score is based on the number of minerals by which one or the other food is richer. The "coverage" charts below show how much of the daily needs can be covered by 300 grams of the food.
5
100 g
300 g
1 slice - 6g 1 cup - 89g 1 leek - 89g
Magnesium
Magnesium
Calcium
Calcium
Potassium
Potassium
Iron
Iron
Copper
Copper
Zinc
Zinc
Phosphorus
Phosphorus
Sodium
Sodium
Manganese
Manganese
Selenium
Selenium
20%
18%
16%
79%
40%
3.3%
15%
2.6%
63%
5.5%
4
100 g
300 g
1 small (3" long) - 5g 1 tbsp chopped - 6g 1 medium (4-1/8" long) - 15g 1 large - 25g
Magnesium
Magnesium
Calcium
Calcium
Potassium
Potassium
Iron
Iron
Copper
Copper
Zinc
Zinc
Phosphorus
Phosphorus
Sodium
Sodium
Manganese
Manganese
Selenium
Selenium
14%
22%
24%
56%
28%
11%
16%
2.1%
21%
3.3%
Vitamin Comparison
Vitamin comparison score is based on the number of vitamins by which one or the other food is richer. The "coverage" charts below show how much of the daily needs can be covered by 300 grams of the food.
4
100 g
300 g
1 slice - 6g 1 cup - 89g 1 leek - 89g
Vitamin C
Vit. C
Vitamin D
Vit. D
Vitamin A
Vit. A
Vitamin E
Vit. E
Vitamin B1
Vit. B1
Vitamin B2
Vit. B2
Vitamin B3
Vit. B3
Vitamin B5
Vit. B5
Vitamin B6
Vit. B6
Vitamin B12
Vit. B12
Vitamin K
Vit. K
Folate
Folate
40%
0%
28%
18%
15%
6.9%
7.5%
8.4%
54%
0%
118%
48%
4
100 g
300 g
1 small (3" long) - 5g 1 tbsp chopped - 6g 1 medium (4-1/8" long) - 15g 1 large - 25g
Vitamin C
Vit. C
Vitamin D
Vit. D
Vitamin A
Vit. A
Vitamin E
Vit. E
Vitamin B1
Vit. B1
Vitamin B2
Vit. B2
Vitamin B3
Vit. B3
Vitamin B5
Vit. B5
Vitamin B6
Vit. B6
Vitamin B12
Vit. B12
Vitamin K
Vit. K
Folate
Folate
63%
0%
17%
11%
14%
18%
9.8%
4.5%
14%
0%
518%
48%
All nutrients comparison - raw data values
Nutrient
DV% diff.
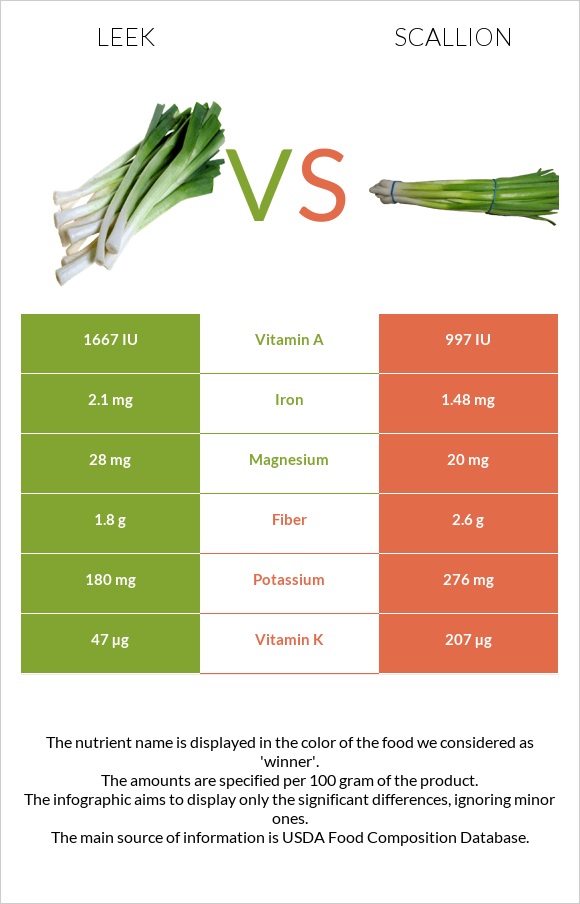
Vitamin K
47µg
207µg
133%
Manganese
0.481mg
0.16mg
14%
Vitamin B6
0.233mg
0.061mg
13%
Vitamin C
12mg
18.8mg
8%
Iron
2.1mg
1.48mg
8%
Copper
0.12mg
0.083mg
4%
Vitamin A
83µg
50µg
4%
Vitamin B2
0.03mg
0.08mg
4%
Potassium
180mg
276mg
3%
Fiber
1.8g
2.6g
3%
Carbs
14.15g
7.34g
2%
Magnesium
28mg
20mg
2%
Zinc
0.12mg
0.39mg
2%
Vitamin E
0.92mg
0.55mg
2%
Calories
61kcal
32kcal
1%
Protein
1.5g
1.83g
1%
Calcium
59mg
72mg
1%
Selenium
1µg
0.6µg
1%
Vitamin B3
0.4mg
0.525mg
1%
Vitamin B5
0.14mg
0.075mg
1%
Choline
9.5mg
5.7mg
1%
Polyunsaturated fat
0.166g
0.074g
1%
Protein per 100 calories
2.5g
5.7g
N/A
Calories per 10 g protein
407kcal
175kcal
N/A
Weight per 100 calories
164g
313g
N/A
Fats
0.3g
0.19g
0%
Net carbs
12.35g
4.74g
N/A
Sugar
3.9g
2.33g
N/A
Phosphorus
35mg
37mg
0%
Sodium
20mg
16mg
0%
Vitamin B1
0.06mg
0.055mg
0%
Folate
64µg
64µg
0%
Saturated fat
0.04g
0.032g
0%
Monounsaturated fat
0.004g
0.027g
0%
Tryptophan
0.012mg
0.02mg
0%
Threonine
0.063mg
0.072mg
0%
Isoleucine
0.052mg
0.077mg
0%
Leucine
0.096mg
0.109mg
0%
Lysine
0.078mg
0.091mg
0%
Methionine
0.018mg
0.02mg
0%
Phenylalanine
0.055mg
0.059mg
0%
Valine
0.056mg
0.081mg
0%
Histidine
0.025mg
0.032mg
0%
Macronutrient Comparison
Macronutrient breakdown side-by-side comparison
3
14%
83%
Protein:
1.5 g
Fats:
0.3 g
Carbs:
14.15 g
Water:
83 g
Other:
1.05 g
2
2%
7%
90%
Protein:
1.83 g
Fats:
0.19 g
Carbs:
7.34 g
Water:
89.83 g
Other:
0.81 g
Contains
more
Fats Fats
+57.9%
Contains
more
Carbs Carbs
+92.8%
Contains
more
Other Other
+29.6%
Contains
more
Protein Protein
+22%
Fat Type Comparison
Fat type breakdown side-by-side comparison
1
19%
2%
79%
Saturated fat:
Sat. Fat
0.04 g
Monounsaturated fat:
Mono. Fat
0.004 g
Polyunsaturated fat:
Poly. Fat
0.166 g
2
24%
20%
56%
Saturated fat:
Sat. Fat
0.032 g
Monounsaturated fat:
Mono. Fat
0.027 g
Polyunsaturated fat:
Poly. Fat
0.074 g
Contains
more
Poly. Fat Polyunsaturated fat
+124.3%
Contains
less
Sat. Fat Saturated fat
-20%
Contains
more
Mono. Fat Monounsaturated fat
+575%