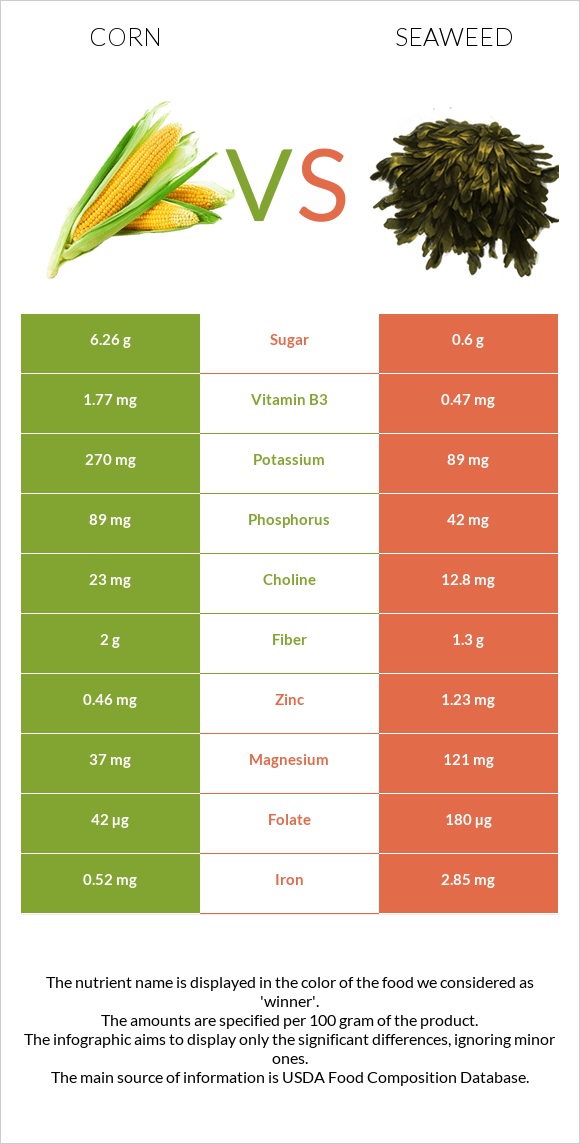
Summary of differences between corn and seaweed Corn has more vitamin B6 and vitamin B3; however, seaweed is higher in vitamin K, folate, iron, magnesium, calcium, copper, and vitamin B2. Seaweed covers your daily need for vitamin K, 55% more than corn. Corn has 70 times more vitamin B6 than seaweed. While corn has 0.139mg of vitamin B6, seaweed has only 0.002mg. Corn has less sodium. These are the specific foods used in this comparison Corn, sweet, yellow, cooked, boiled, drained, without salt and Seaweed, kelp, raw .
Infographic
Mineral Comparison
Mineral comparison score is based on the number of minerals by which one or the other food is richer. The "coverage" charts below show how much of the daily needs can be covered by 300 grams of the food.
3
100 g
300 g
1 baby ear - 8g 1 ear small (5-1/2" to 6-1/2" long) - 89g 1 ear medium (6-3/4" to 7-1/2" long) - 103g 1 ear large (7-3/4" to 9" long) - 118g 1 cup cut - 149g
Magnesium
Magnesium
Calcium
Calcium
Potassium
Potassium
Iron
Iron
Copper
Copper
Zinc
Zinc
Phosphorus
Phosphorus
Sodium
Sodium
Manganese
Manganese
Selenium
Selenium
19%
0.9%
19%
17%
16%
17%
33%
0.13%
22%
1.1%
7
100 g
300 g
2 tbsp (1/8 cup) - 10g
Magnesium
Magnesium
Calcium
Calcium
Potassium
Potassium
Iron
Iron
Copper
Copper
Zinc
Zinc
Phosphorus
Phosphorus
Sodium
Sodium
Manganese
Manganese
Selenium
Selenium
86%
50%
7.9%
107%
43%
34%
18%
30%
26%
3.8%
Vitamin Comparison
Vitamin comparison score is based on the number of vitamins by which one or the other food is richer. The "coverage" charts below show how much of the daily needs can be covered by 300 grams of the food.
6
100 g
300 g
1 baby ear - 8g 1 ear small (5-1/2" to 6-1/2" long) - 89g 1 ear medium (6-3/4" to 7-1/2" long) - 103g 1 ear large (7-3/4" to 9" long) - 118g 1 cup cut - 149g
Vitamin C
Vit. C
Vitamin D
Vit. D
Vitamin A
Vit. A
Vitamin E
Vit. E
Vitamin B1
Vit. B1
Vitamin B2
Vit. B2
Vitamin B3
Vit. B3
Vitamin B5
Vit. B5
Vitamin B6
Vit. B6
Vitamin B12
Vit. B12
Vitamin K
Vit. K
Folate
Folate
18%
0%
4.3%
1.8%
23%
13%
32%
48%
32%
0%
1%
17%
4
100 g
300 g
2 tbsp (1/8 cup) - 10g
Vitamin C
Vit. C
Vitamin D
Vit. D
Vitamin A
Vit. A
Vitamin E
Vit. E
Vitamin B1
Vit. B1
Vitamin B2
Vit. B2
Vitamin B3
Vit. B3
Vitamin B5
Vit. B5
Vitamin B6
Vit. B6
Vitamin B12
Vit. B12
Vitamin K
Vit. K
Folate
Folate
10%
0%
2%
17%
13%
35%
8.8%
39%
0.46%
0%
165%
135%
All nutrients comparison - raw data values
Nutrient
DV% diff.
Vitamin K
0.4µg
66µg
55%
Folate
23µg
180µg
39%
Iron
0.45mg
2.85mg
30%
Magnesium
26mg
121mg
23%
Calcium
3mg
168mg
17%
Vitamin B6
0.139mg
0.002mg
11%
Sodium
1mg
233mg
10%
Copper
0.049mg
0.13mg
9%
Vitamin B3
1.683mg
0.47mg
8%
Vitamin B2
0.057mg
0.15mg
7%
Zinc
0.62mg
1.23mg
6%
Phosphorus
77mg
42mg
5%
Vitamin E
0.09mg
0.87mg
5%
Carbs
20.98g
9.57g
4%
Potassium
218mg
89mg
4%
Fiber
2.4g
1.3g
4%
Vitamin B1
0.093mg
0.05mg
4%
Polyunsaturated fat
0.603g
0.047g
4%
Calories
96kcal
43kcal
3%
Protein
3.41g
1.68g
3%
Vitamin C
5.5mg
3mg
3%
Starch
7.17g
3%
Vitamin B5
0.792mg
0.642mg
3%
Choline
29.1mg
12.8mg
3%
Fats
1.5g
0.56g
1%
Vitamin A
13µg
6µg
1%
Manganese
0.167mg
0.2mg
1%
Selenium
0.2µg
0.7µg
1%
Monounsaturated fat
0.374g
0.098g
1%
Fructose
0.79g
1%
Protein per 100 calories
3.6g
3.9g
N/A
Calories per 10 g protein
282kcal
256kcal
N/A
Weight per 100 calories
104g
233g
N/A
Net carbs
18.58g
8.27g
N/A
Sugar
4.54g
0.6g
N/A
Saturated fat
0.197g
0.247g
0%
Tryptophan
0.023mg
0.048mg
0%
Threonine
0.133mg
0.055mg
0%
Isoleucine
0.133mg
0.076mg
0%
Leucine
0.358mg
0.083mg
0%
Lysine
0.141mg
0.082mg
0%
Methionine
0.069mg
0.025mg
0%
Phenylalanine
0.155mg
0.043mg
0%
Valine
0.191mg
0.072mg
0%
Histidine
0.091mg
0.024mg
0%
Omega-3 - EPA
0g
0.004g
N/A
Macronutrient Comparison
Macronutrient breakdown side-by-side comparison
3
3%
21%
73%
Protein:
3.41 g
Fats:
1.5 g
Carbs:
20.98 g
Water:
73.41 g
Other:
0.7 g
2
2%
10%
82%
7%
Protein:
1.68 g
Fats:
0.56 g
Carbs:
9.57 g
Water:
81.58 g
Other:
6.61 g
Contains
more
Protein Protein
+103%
Contains
more
Fats Fats
+167.9%
Contains
more
Carbs Carbs
+119.2%
Contains
more
Water Water
+11.1%
Contains
more
Other Other
+844.3%
Fat Type Comparison
Fat type breakdown side-by-side comparison
3
17%
32%
51%
Saturated fat:
Sat. Fat
0.197 g
Monounsaturated fat:
Mono. Fat
0.374 g
Polyunsaturated fat:
Poly. Fat
0.603 g
0
63%
25%
12%
Saturated fat:
Sat. Fat
0.247 g
Monounsaturated fat:
Mono. Fat
0.098 g
Polyunsaturated fat:
Poly. Fat
0.047 g
Contains
less
Sat. Fat Saturated fat
-20.2%
Contains
more
Mono. Fat Monounsaturated fat
+281.6%
Contains
more
Poly. Fat Polyunsaturated fat
+1183%