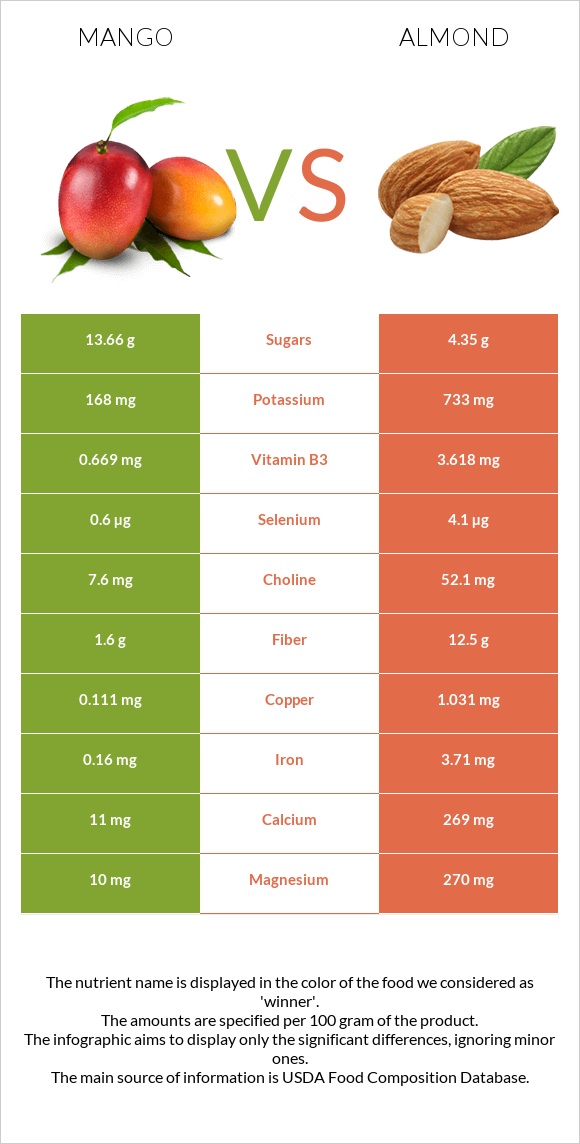
What are the differences between mango and almonds? Mango is higher in vitamin C, yet almonds are higher in vitamin E, copper, manganese, vitamin B2, phosphorus, magnesium, iron, fiber, and zinc. Almonds' daily need coverage for vitamin E is 165% more. The glycemic index of almonds is lower. We used Mangos, raw and Nuts, almonds types in this article.
Infographic
Mineral Comparison
Mineral comparison score is based on the number of minerals by which one or the other food is richer. The "coverage" charts below show how much of the daily needs can be covered by 300 grams of the food.
0
100 g
300 g
1 cup pieces - 165g 1 fruit without refuse - 336g
Magnesium
Magnesium
Calcium
Calcium
Potassium
Potassium
Iron
Iron
Copper
Copper
Zinc
Zinc
Phosphorus
Phosphorus
Sodium
Sodium
Manganese
Manganese
Selenium
Selenium
7.1%
3.3%
15%
6%
37%
2.5%
6%
0.13%
8.2%
3.3%
9
100 g
300 g
1 almond - 1.2g 1 oz (23 whole kernels) - 28.35g 1 cup, sliced - 92g 1 cup, ground - 95g 1 cup, slivered - 108g 1 cup, whole - 143g
Magnesium
Magnesium
Calcium
Calcium
Potassium
Potassium
Iron
Iron
Copper
Copper
Zinc
Zinc
Phosphorus
Phosphorus
Sodium
Sodium
Manganese
Manganese
Selenium
Selenium
193%
81%
65%
139%
344%
85%
206%
0.13%
284%
22%
Vitamin Comparison
Vitamin comparison score is based on the number of vitamins by which one or the other food is richer. The "coverage" charts below show how much of the daily needs can be covered by 300 grams of the food.
3
100 g
300 g
1 cup pieces - 165g 1 fruit without refuse - 336g
Vitamin C
Vit. C
Vitamin D
Vit. D
Vitamin A
Vit. A
Vitamin E
Vit. E
Vitamin B1
Vit. B1
Vitamin B2
Vit. B2
Vitamin B3
Vit. B3
Vitamin B5
Vit. B5
Vitamin B6
Vit. B6
Vitamin B12
Vit. B12
Vitamin K
Vit. K
Folate
Folate
121%
0%
18%
18%
7%
8.8%
13%
12%
27%
0%
11%
32%
6
100 g
300 g
1 almond - 1.2g 1 oz (23 whole kernels) - 28.35g 1 cup, sliced - 92g 1 cup, ground - 95g 1 cup, slivered - 108g 1 cup, whole - 143g
Vitamin C
Vit. C
Vitamin D
Vit. D
Vitamin A
Vit. A
Vitamin E
Vit. E
Vitamin B1
Vit. B1
Vitamin B2
Vit. B2
Vitamin B3
Vit. B3
Vitamin B5
Vit. B5
Vitamin B6
Vit. B6
Vitamin B12
Vit. B12
Vitamin K
Vit. K
Folate
Folate
0%
0%
0%
513%
51%
263%
68%
28%
32%
0%
0%
33%
All nutrients comparison - raw data values
Nutrient
DV% diff.
Vitamin E
0.9mg
25.63mg
165%
Copper
0.111mg
1.031mg
102%
Manganese
0.063mg
2.179mg
92%
Vitamin B2
0.038mg
1.138mg
85%
Polyunsaturated fat
0.071g
12.329g
82%
Monounsaturated fat
0.14g
31.551g
79%
Fats
0.38g
49.93g
76%
Phosphorus
14mg
481mg
67%
Magnesium
10mg
270mg
62%
Iron
0.16mg
3.71mg
44%
Fiber
1.6g
12.5g
44%
Protein
0.82g
21.15g
41%
Vitamin C
36.4mg
0mg
40%
Zinc
0.09mg
3.12mg
28%
Calories
60kcal
579kcal
26%
Calcium
11mg
269mg
26%
Vitamin B3
0.669mg
3.618mg
18%
Potassium
168mg
733mg
17%
Saturated fat
0.092g
3.802g
17%
Vitamin B1
0.028mg
0.205mg
15%
Choline
7.6mg
52.1mg
8%
Vitamin A
54µg
0µg
6%
Selenium
0.6µg
4.1µg
6%
Fructose
4.68g
0.11g
6%
Vitamin B5
0.197mg
0.471mg
5%
Vitamin K
4.2µg
0µg
4%
Carbs
14.98g
21.55g
2%
Vitamin B6
0.119mg
0.137mg
1%
Protein per 100 calories
1.4g
3.7g
N/A
Calories per 10 g protein
732kcal
274kcal
N/A
Weight per 100 calories
167g
17g
N/A
Unsaturated / Saturated Fat ratio
2.3
12
N/A
Net carbs
13.38g
9.05g
N/A
Sugar
13.66g
4.35g
N/A
Starch
0.72g
0%
Sodium
1mg
1mg
0%
Folate
43µg
44µg
0%
Trans fat
0g
0.015g
N/A
Tryptophan
0.013mg
0.211mg
0%
Threonine
0.031mg
0.601mg
0%
Isoleucine
0.029mg
0.751mg
0%
Leucine
0.05mg
1.473mg
0%
Lysine
0.066mg
0.568mg
0%
Methionine
0.008mg
0.157mg
0%
Phenylalanine
0.027mg
1.132mg
0%
Valine
0.042mg
0.855mg
0%
Histidine
0.019mg
0.539mg
0%
Omega-3 - ALA
0.003g
N/A
Omega-6 - Eicosadienoic acid
0.002g
N/A
Omega-6 - Linoleic acid
12.32g
N/A
Macronutrient Comparison
Macronutrient breakdown side-by-side comparison
1
15%
83%
Protein:
0.82 g
Fats:
0.38 g
Carbs:
14.98 g
Water:
83.46 g
Other:
0.36 g
4
21%
50%
22%
4%
3%
Protein:
21.15 g
Fats:
49.93 g
Carbs:
21.55 g
Water:
4.41 g
Other:
2.96 g
Contains
more
Water Water
+1792.5%
Contains
more
Protein Protein
+2479.3%
Contains
more
Fats Fats
+13039.5%
Contains
more
Carbs Carbs
+43.9%
Contains
more
Other Other
+722.2%
Fat Type Comparison
Fat type breakdown side-by-side comparison
1
30%
46%
23%
Saturated fat:
Sat. Fat
0.092 g
Monounsaturated fat:
Mono. Fat
0.14 g
Polyunsaturated fat:
Poly. Fat
0.071 g
2
8%
66%
26%
Saturated fat:
Sat. Fat
3.802 g
Monounsaturated fat:
Mono. Fat
31.551 g
Polyunsaturated fat:
Poly. Fat
12.329 g
Contains
less
Sat. Fat Saturated fat
-97.6%
Contains
more
Mono. Fat Monounsaturated fat
+22436.4%
Contains
more
Poly. Fat Polyunsaturated fat
+17264.8%
Carbohydrate type comparison
Carbohydrate type breakdown side-by-side comparison
3
51%
15%
34%
Starch:
0 g
Sucrose:
6.97 g
Glucose:
2.01 g
Fructose:
4.68 g
Lactose:
0 g
Maltose:
0 g
Galactose:
0 g
3
14%
78%
3%
2%
Starch:
0.72 g
Sucrose:
3.95 g
Glucose:
0.17 g
Fructose:
0.11 g
Lactose:
0 g
Maltose:
0.04 g
Galactose:
0.07 g
Contains
more
Sucrose Sucrose
+76.5%
Contains
more
Glucose Glucose
+1082.4%
Contains
more
Fructose Fructose
+4154.5%
Contains
more
Starch Starch
+∞%
Contains
more
Maltose Maltose
+∞%
Contains
more
Galactose Galactose
+∞%