McDonald's cheeseburger vs. BURGER KING, Hamburger — In-Depth Nutrition Comparison
Compare
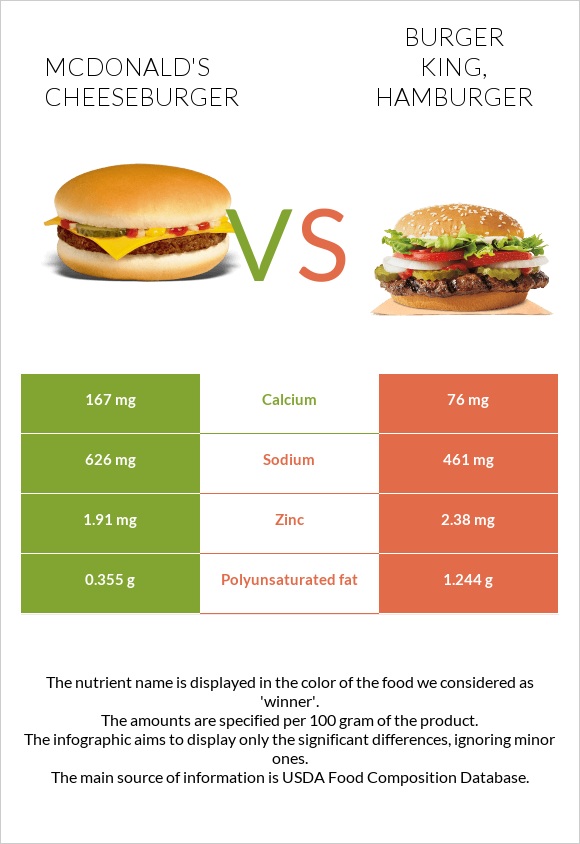
Summary of differences between mcDonald's cheeseburgers and bURGER KING, Hamburger
- McDonald's cheeseburgers have more calcium, while bURGER KING, Hamburger has more vitamin B1, iron, and polyunsaturated fat.
- McDonald's cheeseburgers contain 2 times more calcium than bURGER KING, Hamburger. While mcDonald's cheeseburgers contain 167mg of calcium, bURGER KING, Hamburger contains only 76mg.
- The amount of sodium in bURGER KING, Hamburger is lower.
These are the specific foods used in this comparison McDONALD'S, Cheeseburger and BURGER KING, Hamburger.
Infographic
Infographic link
Mineral Comparison
Mineral comparison score is based on the number of minerals by which one or the other food is richer. The "coverage" charts below show how much of the daily needs can be covered by 300 grams of the food.
| Contains more CalciumCalcium | +119.7% |
| Contains more MagnesiumMagnesium | +25% |
| Contains more IronIron | +22.1% |
| Contains more CopperCopper | +24.7% |
| Contains more ZincZinc | +24.6% |
| Contains less SodiumSodium | -26.4% |
| Contains more ManganeseManganese | +42.2% |
Vitamin Comparison
Vitamin comparison score is based on the number of vitamins by which one or the other food is richer. The "coverage" charts below show how much of the daily needs can be covered by 300 grams of the food.
| Contains more Vitamin CVitamin C | +200% |
| Contains more Vitamin B2Vitamin B2 | +14.5% |
| Contains more Vitamin B12Vitamin B12 | +∞% |
| Contains more Vitamin B1Vitamin B1 | +49.8% |
All nutrients comparison - raw data values
| Nutrient |  |
 |
DV% diff. |
| Selenium | 24.9µg | 45% | |
| Vitamin B12 | 0.86µg | 36% | |
| Vitamin B1 | 0.223mg | 0.334mg | 9% |
| Calcium | 167mg | 76mg | 9% |
| Vitamin B6 | 0.101mg | 8% | |
| Sodium | 626mg | 461mg | 7% |
| Iron | 2.35mg | 2.87mg | 7% |
| Polyunsaturated fat | 0.355g | 1.244g | 6% |
| Vitamin K | 5.5µg | 5% | |
| Manganese | 0.23mg | 0.327mg | 4% |
| Zinc | 1.91mg | 2.38mg | 4% |
| Protein | 12.97g | 14.85g | 4% |
| Vitamin B5 | 0.222mg | 4% | |
| Copper | 0.097mg | 0.121mg | 3% |
| Saturated fat | 4.435g | 3.821g | 3% |
| Vitamin B2 | 0.26mg | 0.227mg | 3% |
| Phosphorus | 140mg | 126mg | 2% |
| Monounsaturated fat | 3.631g | 4.249g | 2% |
| Fats | 11.79g | 10.55g | 2% |
| Potassium | 200mg | 217mg | 1% |
| Magnesium | 20mg | 25mg | 1% |
| Folate | 59µg | 64µg | 1% |
| Calories | 263kcal | 261kcal | 0% |
| Vitamin C | 0.6mg | 0.2mg | 0% |
| Carbs | 27.81g | 26.76g | 0% |
| Net carbs | 26.71g | 25.76g | N/A |
| Cholesterol | 35mg | 35mg | 0% |
| Sugar | 6.22g | 5.6g | N/A |
| Fiber | 1.1g | 1g | 0% |
| Vitamin E | 0.04mg | 0% | |
| Vitamin B3 | 4.026mg | 3.947mg | 0% |
| Trans fat | 0.647g | 0.467g | N/A |
| Fructose | 2.59g | 2.73g | 0% |
| Omega-3 - EPA | 0.003g | N/A | |
| Omega-3 - DHA | 0.001g | N/A | |
| Omega-3 - ALA | 0.106g | N/A | |
| Omega-3 - DPA | 0.009g | N/A | |
| Omega-3 - Eicosatrienoic acid | 0.002g | N/A | |
| Omega-6 - Gamma-linoleic acid | 0.001g | N/A | |
| Omega-6 - Dihomo-gamma-linoleic acid | 0.012g | N/A | |
| Omega-6 - Eicosadienoic acid | 0.003g | N/A | |
| Omega-6 - Linoleic acid | 0.967g | N/A |
Macronutrient Comparison
Macronutrient breakdown side-by-side comparison
Protein:
12.97 g
Fats:
11.79 g
Carbs:
27.81 g
Water:
45 g
Other:
2.43 g
Protein:
14.85 g
Fats:
10.55 g
Carbs:
26.76 g
Water:
45.97 g
Other:
1.87 g
| Contains more FatsFats | +11.8% |
| Contains more OtherOther | +29.9% |
| Contains more ProteinProtein | +14.5% |
~equal in
Carbs
~26.76g
~equal in
Water
~45.97g
Fat Type Comparison
Fat type breakdown side-by-side comparison
Saturated fat:
Sat. Fat
4.435 g
Monounsaturated fat:
Mono. Fat
3.631 g
Polyunsaturated fat:
Poly. Fat
0.355 g
Saturated fat:
Sat. Fat
3.821 g
Monounsaturated fat:
Mono. Fat
4.249 g
Polyunsaturated fat:
Poly. Fat
1.244 g
| Contains less Sat. FatSaturated fat | -13.8% |
| Contains more Mono. FatMonounsaturated fat | +17% |
| Contains more Poly. FatPolyunsaturated fat | +250.4% |
Carbohydrate type comparison
Carbohydrate type breakdown side-by-side comparison
Starch:
0 g
Sucrose:
0.24 g
Glucose:
2.01 g
Fructose:
2.59 g
Lactose:
0.54 g
Maltose:
0.84 g
Galactose:
0 g
Starch:
0 g
Sucrose:
0 g
Glucose:
2.27 g
Fructose:
2.73 g
Lactose:
0 g
Maltose:
0.6 g
Galactose:
0 g
| Contains more SucroseSucrose | +∞% |
| Contains more LactoseLactose | +∞% |
| Contains more MaltoseMaltose | +40% |
| Contains more GlucoseGlucose | +12.9% |
~equal in
Starch
~0g
~equal in
Fructose
~2.73g
~equal in
Galactose
~0g