McDonald's french fries vs. French fries — In-Depth Nutrition Comparison
Compare
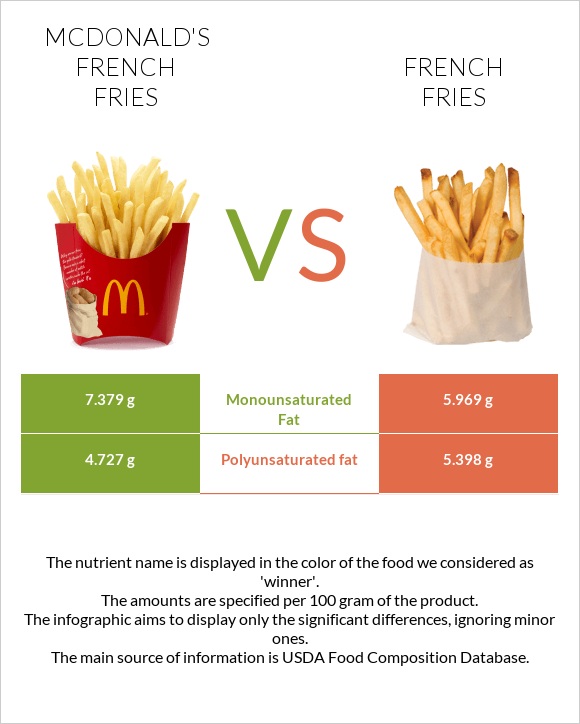
What are the main differences between mcDonald's french fries and french fries?
- McDonald's french fries are richer in monounsaturated fat, while french fries are higher in polyunsaturated fat.
We used McDONALD'S, french fries and Fast foods, potato, french fried in vegetable oil types in this comparison.
Infographic
Infographic link
Mineral Comparison
Mineral comparison score is based on the number of minerals by which one or the other food is richer. The "coverage" charts below show how much of the daily needs can be covered by 300 grams of the food.
| Contains less SodiumSodium | -10% |
| Contains more SeleniumSelenium | +125% |
Vitamin Comparison
Vitamin comparison score is based on the number of vitamins by which one or the other food is richer. The "coverage" charts below show how much of the daily needs can be covered by 300 grams of the food.
| Contains more Vitamin CVitamin C | +19.1% |
| Contains more Vitamin KVitamin K | +42.9% |
| Contains more Vitamin EVitamin E | +21% |
All nutrients comparison - raw data values
| Nutrient |  |
 |
DV% diff. |
| Starch | 38.23g | 16% | |
| Folate | 30µg | 8% | |
| Vitamin K | 16µg | 11.2µg | 4% |
| Monounsaturated fat | 7.379g | 5.969g | 4% |
| Polyunsaturated fat | 4.727g | 5.398g | 4% |
| Vitamin E | 1.38mg | 1.67mg | 2% |
| Calories | 323kcal | 312kcal | 1% |
| Fats | 15.47g | 14.73g | 1% |
| Vitamin C | 5.6mg | 4.7mg | 1% |
| Potassium | 596mg | 579mg | 1% |
| Copper | 0.114mg | 0.124mg | 1% |
| Sodium | 189mg | 210mg | 1% |
| Selenium | 0.4µg | 0.9µg | 1% |
| Vitamin B1 | 0.18mg | 0.17mg | 1% |
| Vitamin B3 | 3.22mg | 3.004mg | 1% |
| Vitamin B6 | 0.38mg | 0.372mg | 1% |
| Choline | 39.8mg | 36.8mg | 1% |
| Protein | 3.41g | 3.43g | 0% |
| Protein per 100 calories | 1.1g | 1.1g | N/A |
| Calories per 10 g protein | 947kcal | 910kcal | N/A |
| Weight per 100 calories | 31g | 32g | N/A |
| Unsaturated / Saturated Fat ratio | 5.3 | 4.9 | N/A |
| Net carbs | 38.68g | 37.64g | N/A |
| Carbs | 42.58g | 41.44g | 0% |
| Magnesium | 37mg | 35mg | 0% |
| Calcium | 19mg | 18mg | 0% |
| Iron | 0.8mg | 0.81mg | 0% |
| Sugar | 0.21g | 0.3g | N/A |
| Fiber | 3.9g | 3.8g | 0% |
| Zinc | 0.51mg | 0.5mg | 0% |
| Phosphorus | 127mg | 125mg | 0% |
| Manganese | 0.249mg | 0.247mg | 0% |
| Vitamin B2 | 0.037mg | 0.039mg | 0% |
| Vitamin B5 | 0.59mg | 0.58mg | 0% |
| Trans fat | 0.064g | 0.06g | N/A |
| Saturated fat | 2.271g | 2.336g | 0% |
| Omega-3 - ALA | 0.382g | 0.407g | N/A |
| Omega-3 - Eicosatrienoic acid | 0g | 0.001g | N/A |
| Omega-6 - Gamma-linoleic acid | 0.031g | 0.029g | N/A |
| Omega-6 - Eicosadienoic acid | 0.009g | 0.007g | N/A |
| Omega-6 - Linoleic acid | 4.251g | 4.898g | N/A |
Macronutrient Comparison
Macronutrient breakdown side-by-side comparison
Protein:
3.41 g
Fats:
15.47 g
Carbs:
42.58 g
Water:
36.63 g
Other:
1.91 g
Protein:
3.43 g
Fats:
14.73 g
Carbs:
41.44 g
Water:
38.55 g
Other:
1.85 g
~equal in
Protein
~3.43g
~equal in
Fats
~14.73g
~equal in
Carbs
~41.44g
~equal in
Water
~38.55g
~equal in
Other
~1.85g
Fat Type Comparison
Fat type breakdown side-by-side comparison
Saturated fat:
Sat. Fat
2.271 g
Monounsaturated fat:
Mono. Fat
7.379 g
Polyunsaturated fat:
Poly. Fat
4.727 g
Saturated fat:
Sat. Fat
2.336 g
Monounsaturated fat:
Mono. Fat
5.969 g
Polyunsaturated fat:
Poly. Fat
5.398 g
| Contains more Mono. FatMonounsaturated fat | +23.6% |
| Contains more Poly. FatPolyunsaturated fat | +14.2% |
~equal in
Saturated fat
~2.336g


