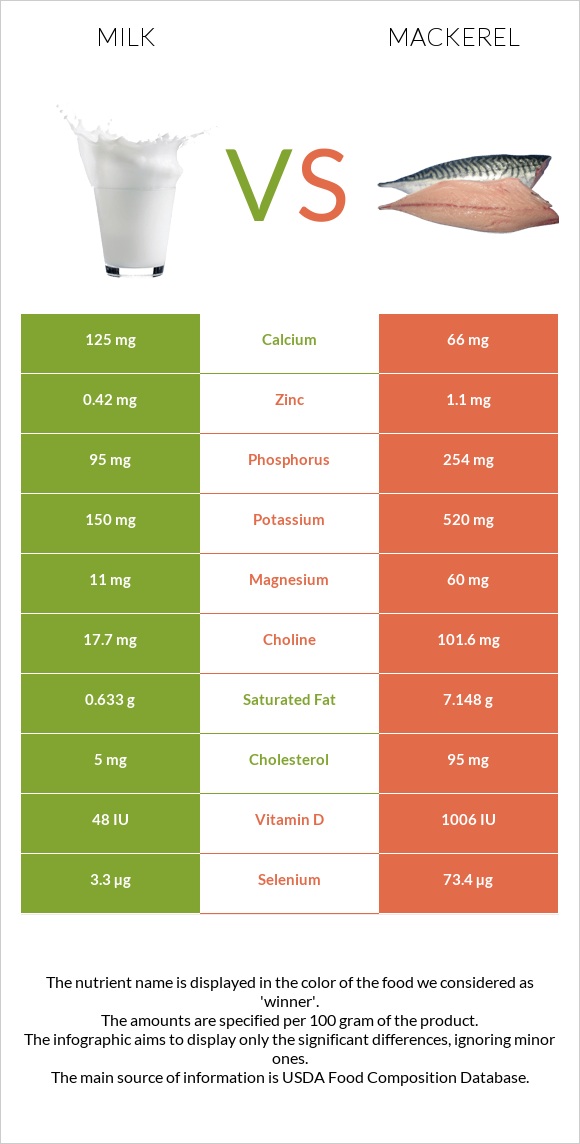
Important differences between milk and mackerel Mackerel has more vitamin B12, selenium, vitamin D*, vitamin B6, phosphorus, vitamin B3, and iron than milk. Mackerel's daily need coverage for vitamin B12 is 480% more. Milk contains less saturated fat. Milk has a higher glycemic index. The glycemic index of milk is 31, while the glycemic index of mackerel is 0. The food varieties used in the comparison are Milk, lowfat, fluid, 1% milkfat, with added vitamin A and vitamin D and Fish, mackerel, salted .
Infographic
Mineral Comparison
Mineral comparison score is based on the number of minerals by which one or the other food is richer. The "coverage" charts below show how much of the daily needs can be covered by 300 grams of the food.
3
100 g
300 g
1 fl oz - 30.5g 1 cup - 244g 1 quart - 976g
Magnesium
Magnesium
Calcium
Calcium
Potassium
Potassium
Iron
Iron
Copper
Copper
Zinc
Zinc
Phosphorus
Phosphorus
Sodium
Sodium
Manganese
Manganese
Selenium
Selenium
7.9%
38%
13%
1.1%
3.3%
11%
41%
5.7%
0.39%
18%
7
100 g
300 g
1 cubic inch, boneless - 17g 1 piece (5-1/2" x 1-1/2" x 1/2") - 80g 1 cup, cooked - 136g
Magnesium
Magnesium
Calcium
Calcium
Potassium
Potassium
Iron
Iron
Copper
Copper
Zinc
Zinc
Phosphorus
Phosphorus
Sodium
Sodium
Manganese
Manganese
Selenium
Selenium
43%
20%
46%
53%
33%
30%
109%
580%
0%
400%
Vitamin Comparison
Vitamin comparison score is based on the number of vitamins by which one or the other food is richer. The "coverage" charts below show how much of the daily needs can be covered by 300 grams of the food.
2
100 g
300 g
1 fl oz - 30.5g 1 cup - 244g 1 quart - 976g
Vitamin C
Vit. C
Vitamin D
Vit. D
Vitamin A
Vit. A
Vitamin E
Vit. E
Vitamin B1
Vit. B1
Vitamin B2
Vit. B2
Vitamin B3
Vit. B3
Vitamin B5
Vit. B5
Vitamin B6
Vit. B6
Vitamin B12
Vit. B12
Vitamin K
Vit. K
Folate
Folate
0%
18%
19%
0.2%
5%
43%
1.7%
22%
8.5%
59%
0.25%
3.8%
7
100 g
300 g
1 cubic inch, boneless - 17g 1 piece (5-1/2" x 1-1/2" x 1/2") - 80g 1 cup, cooked - 136g
Vitamin C
Vit. C
Vitamin D
Vit. D
Vitamin A
Vit. A
Vitamin E
Vit. E
Vitamin B1
Vit. B1
Vitamin B2
Vit. B2
Vitamin B3
Vit. B3
Vitamin B5
Vit. B5
Vitamin B6
Vit. B6
Vitamin B12
Vit. B12
Vitamin K
Vit. K
Folate
Folate
0%
378%
16%
48%
5%
44%
62%
0%
95%
1500%
20%
11%
All nutrients comparison - raw data values
Nutrient
DV% diff.
Vitamin B12
0.47µg
12µg
480%
Sodium
44mg
4450mg
192%
Selenium
3.3µg
73.4µg
127%
Vitamin D*
48 IU
1006 IU
120%
Vitamin D
1.2µg
25.2µg
120%
Polyunsaturated fat
0.035g
6.21g
41%
Fats
0.97g
25.1g
37%
Protein
3.37g
18.5g
30%
Cholesterol
5mg
95mg
30%
Saturated fat
0.633g
7.148g
30%
Vitamin B6
0.037mg
0.41mg
29%
Phosphorus
95mg
254mg
23%
Vitamin B3
0.093mg
3.3mg
20%
Monounsaturated fat
0.277g
8.32g
20%
Iron
0.03mg
1.4mg
17%
Vitamin E
0.01mg
2.38mg
16%
Choline
17.7mg
101.6mg
15%
Calories
42kcal
305kcal
13%
Magnesium
11mg
60mg
12%
Potassium
150mg
520mg
11%
Copper
0.01mg
0.1mg
10%
Vitamin B5
0.361mg
7%
Calcium
125mg
66mg
6%
Zinc
0.42mg
1.1mg
6%
Vitamin K
0.1µg
7.8µg
6%
Folate
5µg
15µg
3%
Carbs
4.99g
0g
2%
Vitamin A
58µg
47µg
1%
Protein per 100 calories
8g
6.1g
N/A
Calories per 10 g protein
125kcal
165kcal
N/A
Weight per 100 calories
238g
33g
N/A
Unsaturated / Saturated Fat ratio
0.49
2
N/A
Net carbs
4.99g
0g
N/A
Sugar
5.2g
0g
N/A
Manganese
0.003mg
0%
Vitamin B1
0.02mg
0.02mg
0%
Vitamin B2
0.185mg
0.19mg
0%
Tryptophan
0.043mg
0%
Threonine
0.143mg
0%
Isoleucine
0.174mg
0%
Leucine
0.319mg
0%
Lysine
0.282mg
0%
Methionine
0.088mg
0%
Phenylalanine
0.174mg
0%
Valine
0.22mg
0%
Histidine
0.101mg
0%
Omega-3 - EPA
0g
1.619g
N/A
Omega-3 - DHA
0g
2.965g
N/A
Omega-3 - ALA
0.004g
N/A
Omega-3 - DPA
0g
0.391g
N/A
Omega-6 - Linoleic acid
0.027g
N/A
Macronutrient Comparison
Macronutrient breakdown side-by-side comparison
2
3%
5%
90%
Protein:
3.37 g
Fats:
0.97 g
Carbs:
4.99 g
Water:
89.92 g
Other:
0.75 g
3
19%
25%
43%
13%
Protein:
18.5 g
Fats:
25.1 g
Carbs:
0 g
Water:
43 g
Other:
13.4 g
Contains
more
Carbs Carbs
+∞%
Contains
more
Water Water
+109.1%
Contains
more
Protein Protein
+449%
Contains
more
Fats Fats
+2487.6%
Contains
more
Other Other
+1686.7%
Fat Type Comparison
Fat type breakdown side-by-side comparison
1
67%
29%
4%
Saturated fat:
Sat. Fat
0.633 g
Monounsaturated fat:
Mono. Fat
0.277 g
Polyunsaturated fat:
Poly. Fat
0.035 g
2
33%
38%
29%
Saturated fat:
Sat. Fat
7.148 g
Monounsaturated fat:
Mono. Fat
8.32 g
Polyunsaturated fat:
Poly. Fat
6.21 g
Contains
less
Sat. Fat Saturated fat
-91.1%
Contains
more
Mono. Fat Monounsaturated fat
+2903.6%
Contains
more
Poly. Fat Polyunsaturated fat
+17642.9%