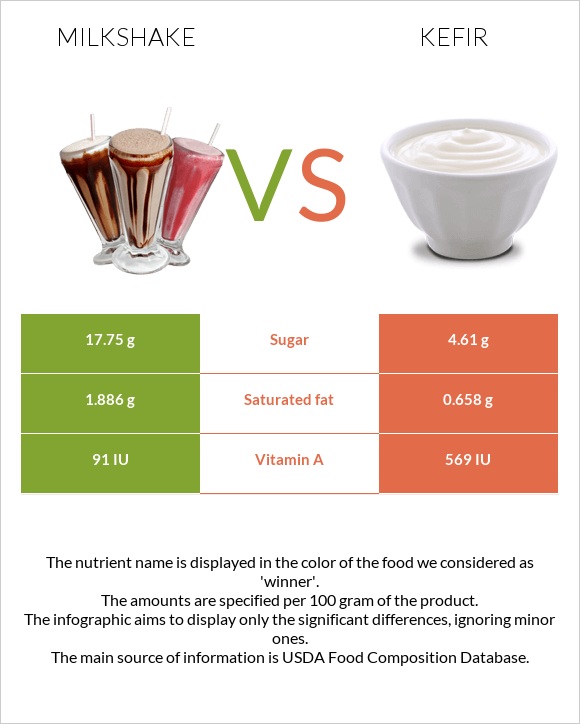
Significant differences between milkshake and kefir Milkshake has more vitamin B12; however, kefir is richer in vitamin A. Kefir has 4 times less sugar than milkshake. Milkshake has 17.75g of sugar, while kefir has 4.61g. Specific food types used in this comparison are Milk shakes, thick vanilla and Kefir, lowfat, plain, LIFEWAY .
Infographic
Mineral Comparison
Mineral comparison score is based on the number of minerals by which one or the other food is richer. The "coverage" charts below show how much of the daily needs can be covered by 300 grams of the food.
5
100 g
300 g
1 fl oz - 28.4g 1 container (11 oz) - 313g
Magnesium
Magnesium
Calcium
Calcium
Potassium
Potassium
Iron
Iron
Copper
Copper
Zinc
Zinc
Phosphorus
Phosphorus
Sodium
Sodium
Manganese
Manganese
Selenium
Selenium
8.6%
44%
16%
3.8%
17%
11%
49%
12%
1.8%
13%
3
100 g
300 g
Magnesium
Magnesium
Calcium
Calcium
Potassium
Potassium
Iron
Iron
Copper
Copper
Zinc
Zinc
Phosphorus
Phosphorus
Sodium
Sodium
Manganese
Manganese
Selenium
Selenium
8.6%
39%
14%
1.5%
3%
13%
45%
5.2%
0.65%
20%
Vitamin Comparison
Vitamin comparison score is based on the number of vitamins by which one or the other food is richer. The "coverage" charts below show how much of the daily needs can be covered by 300 grams of the food.
5
100 g
300 g
1 fl oz - 28.4g 1 container (11 oz) - 313g
Vitamin C
Vit. C
Vitamin D
Vit. D
Vitamin A
Vit. A
Vitamin E
Vit. E
Vitamin B1
Vit. B1
Vitamin B2
Vit. B2
Vitamin B3
Vit. B3
Vitamin B5
Vit. B5
Vitamin B6
Vit. B6
Vitamin B12
Vit. B12
Vitamin K
Vit. K
Folate
Folate
0%
18%
8.3%
1%
7.5%
45%
2.7%
22%
9.7%
65%
0.5%
5.3%
4
100 g
300 g
Vitamin C
Vit. C
Vitamin D
Vit. D
Vitamin A
Vit. A
Vitamin E
Vit. E
Vitamin B1
Vit. B1
Vitamin B2
Vit. B2
Vitamin B3
Vit. B3
Vitamin B5
Vit. B5
Vitamin B6
Vit. B6
Vitamin B12
Vit. B12
Vitamin K
Vit. K
Folate
Folate
0.67%
15%
57%
0.4%
7.5%
31%
2.8%
23%
13%
36%
0.25%
9.8%
All nutrients comparison - raw data values
Nutrient
DV% diff.
Vitamin A
25µg
171µg
16%
Vitamin B12
0.52µg
0.29µg
10%
Saturated fat
1.886g
0.658g
6%
Copper
0.051mg
0.009mg
5%
Vitamin B2
0.195mg
0.135mg
5%
Calories
112kcal
41kcal
4%
Carbs
17.75g
4.48g
4%
Fats
3.03g
0.93g
3%
Cholesterol
12mg
5mg
2%
Calcium
146mg
130mg
2%
Sodium
95mg
40mg
2%
Selenium
2.3µg
3.6µg
2%
Folate
7µg
13µg
2%
Vitamin D*
48 IU
41 IU
1%
Vitamin D
1.2µg
1µg
1%
Potassium
183mg
164mg
1%
Iron
0.1mg
0.04mg
1%
Zinc
0.39mg
0.46mg
1%
Phosphorus
115mg
105mg
1%
Vitamin B6
0.042mg
0.058mg
1%
Monounsaturated fat
0.875g
0.31g
1%
Protein
3.86g
3.79g
0%
Protein per 100 calories
3.4g
9.2g
N/A
Calories per 10 g protein
290kcal
108kcal
N/A
Weight per 100 calories
89g
244g
N/A
Unsaturated / Saturated Fat ratio
0.52
0.55
N/A
Vitamin C
0mg
0.2mg
0%
Net carbs
17.75g
4.48g
N/A
Magnesium
12mg
12mg
0%
Sugar
17.75g
4.61g
N/A
Vitamin E
0.05mg
0.02mg
0%
Manganese
0.014mg
0.005mg
0%
Vitamin B1
0.03mg
0.03mg
0%
Vitamin B3
0.146mg
0.15mg
0%
Vitamin B5
0.368mg
0.385mg
0%
Vitamin K
0.2µg
0.1µg
0%
Trans fat
0.037g
N/A
Choline
14.3mg
15.2mg
0%
Polyunsaturated fat
0.113g
0.053g
0%
Tryptophan
0.054mg
0%
Threonine
0.174mg
0%
Isoleucine
0.234mg
0%
Leucine
0.378mg
0%
Lysine
0.306mg
0%
Methionine
0.097mg
0%
Phenylalanine
0.186mg
0%
Valine
0.258mg
0%
Histidine
0.105mg
0%
Omega-3 - ALA
0.006g
N/A
Omega-3 - DPA
0g
0.001g
N/A
Omega-6 - Dihomo-gamma-linoleic acid
0.002g
N/A
Omega-6 - Linoleic acid
0.029g
N/A
Macronutrient Comparison
Macronutrient breakdown side-by-side comparison
4
4%
3%
18%
74%
Protein:
3.86 g
Fats:
3.03 g
Carbs:
17.75 g
Water:
74.45 g
Other:
0.91 g
1
4%
4%
90%
Protein:
3.79 g
Fats:
0.93 g
Carbs:
4.48 g
Water:
90.07 g
Other:
0.73 g
Contains
more
Fats Fats
+225.8%
Contains
more
Carbs Carbs
+296.2%
Contains
more
Other Other
+24.7%
Contains
more
Water Water
+21%
Fat Type Comparison
Fat type breakdown side-by-side comparison
2
66%
30%
4%
Saturated fat:
Sat. Fat
1.886 g
Monounsaturated fat:
Mono. Fat
0.875 g
Polyunsaturated fat:
Poly. Fat
0.113 g
1
64%
30%
5%
Saturated fat:
Sat. Fat
0.658 g
Monounsaturated fat:
Mono. Fat
0.31 g
Polyunsaturated fat:
Poly. Fat
0.053 g
Contains
more
Mono. Fat Monounsaturated fat
+182.3%
Contains
more
Poly. Fat Polyunsaturated fat
+113.2%
Contains
less
Sat. Fat Saturated fat
-65.1%