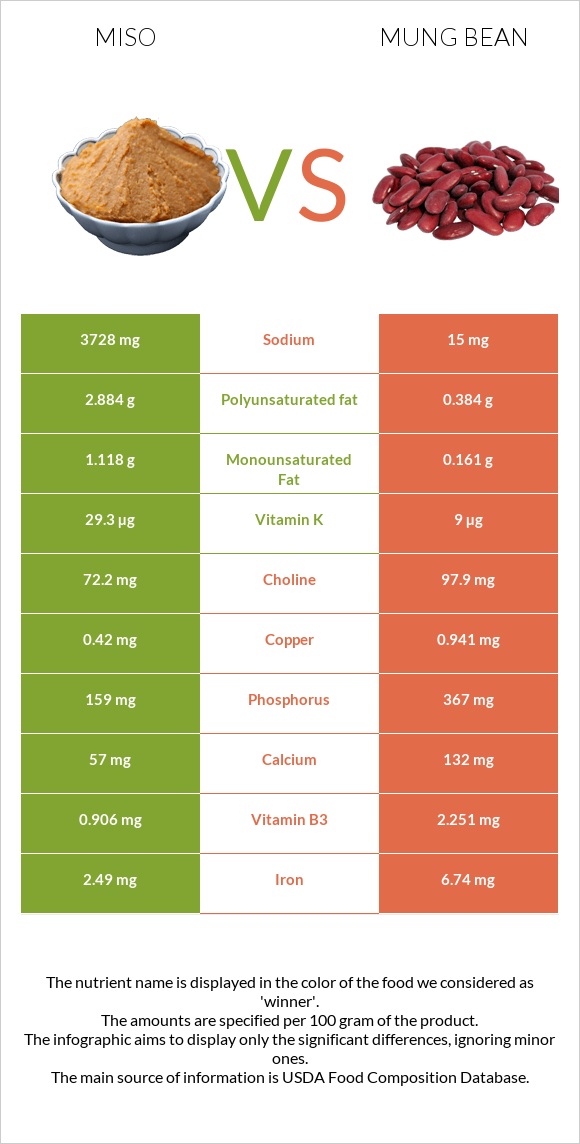
Important differences between miso and mung beans Mung beans have more folate, copper, iron, fiber, vitamin B1, magnesium, vitamin B5, potassium, and phosphorus than miso. Miso's daily need coverage for sodium is 161% more. Mung beans contain less sodium. Miso has a higher glycemic index. The glycemic index of miso is 61, while the glycemic index of mung beans is 31. The food varieties used in the comparison are Miso and Mung beans, mature seeds, raw .
Infographic
Mineral Comparison
Mineral comparison score is based on the number of minerals by which one or the other food is richer. The "coverage" charts below show how much of the daily needs can be covered by 300 grams of the food.
0
100 g
300 g
1 tbsp - 17g 1 cup - 275g
Magnesium
Magnesium
Calcium
Calcium
Potassium
Potassium
Iron
Iron
Copper
Copper
Zinc
Zinc
Phosphorus
Phosphorus
Sodium
Sodium
Manganese
Manganese
Selenium
Selenium
34%
17%
19%
93%
140%
70%
68%
486%
112%
38%
9
100 g
300 g
1 tbsp - 13g 1 cup - 207g
Magnesium
Magnesium
Calcium
Calcium
Potassium
Potassium
Iron
Iron
Copper
Copper
Zinc
Zinc
Phosphorus
Phosphorus
Sodium
Sodium
Manganese
Manganese
Selenium
Selenium
135%
40%
110%
253%
314%
73%
157%
2%
135%
45%
Vitamin Comparison
Vitamin comparison score is based on the number of vitamins by which one or the other food is richer. The "coverage" charts below show how much of the daily needs can be covered by 300 grams of the food.
2
100 g
300 g
1 tbsp - 17g 1 cup - 275g
Vitamin C
Vit. C
Vitamin D
Vit. D
Vitamin A
Vit. A
Vitamin E
Vit. E
Vitamin B1
Vit. B1
Vitamin B2
Vit. B2
Vitamin B3
Vit. B3
Vitamin B5
Vit. B5
Vitamin B6
Vit. B6
Vitamin B12
Vit. B12
Vitamin K
Vit. K
Folate
Folate
0%
0%
1.3%
0.2%
25%
54%
17%
20%
46%
10%
73%
14%
8
100 g
300 g
1 tbsp - 13g 1 cup - 207g
Vitamin C
Vit. C
Vitamin D
Vit. D
Vitamin A
Vit. A
Vitamin E
Vit. E
Vitamin B1
Vit. B1
Vitamin B2
Vit. B2
Vitamin B3
Vit. B3
Vitamin B5
Vit. B5
Vitamin B6
Vit. B6
Vitamin B12
Vit. B12
Vitamin K
Vit. K
Folate
Folate
16%
0%
2%
10%
155%
54%
42%
115%
88%
0%
23%
469%
All nutrients comparison - raw data values
Nutrient
DV% diff.
Sodium
3728mg
15mg
161%
Folate
19µg
625µg
152%
Copper
0.42mg
0.941mg
58%
Iron
2.49mg
6.74mg
53%
Fiber
5.4g
16.3g
44%
Vitamin B1
0.098mg
0.621mg
44%
Magnesium
48mg
189mg
34%
Vitamin B5
0.337mg
1.91mg
31%
Potassium
210mg
1246mg
30%
Phosphorus
159mg
367mg
30%
Protein
12.79g
23.86g
22%
Vitamin K
29.3µg
9µg
17%
Polyunsaturated fat
2.884g
0.384g
17%
Vitamin B6
0.199mg
0.382mg
14%
Carbs
25.37g
62.62g
12%
Calcium
57mg
132mg
8%
Manganese
0.859mg
1.035mg
8%
Vitamin B3
0.906mg
2.251mg
8%
Fructose
6g
8%
Calories
198kcal
347kcal
7%
Fats
6.01g
1.15g
7%
Vitamin C
0mg
4.8mg
5%
Choline
72.2mg
97.9mg
5%
Vitamin E
0.01mg
0.51mg
3%
Vitamin B12
0.08µg
0µg
3%
Saturated fat
1.025g
0.348g
3%
Selenium
7µg
8.2µg
2%
Monounsaturated fat
1.118g
0.161g
2%
Zinc
2.56mg
2.68mg
1%
Protein per 100 calories
6.5g
6.9g
N/A
Calories per 10 g protein
155kcal
145kcal
N/A
Weight per 100 calories
51g
29g
N/A
Unsaturated / Saturated Fat ratio
3.9
1.6
N/A
Net carbs
19.97g
46.32g
N/A
Sugar
6.2g
6.6g
N/A
Vitamin A
4µg
6µg
0%
Vitamin B2
0.233mg
0.233mg
0%
Tryptophan
0.155mg
0.26mg
0%
Threonine
0.479mg
0.782mg
0%
Isoleucine
0.508mg
1.008mg
0%
Leucine
0.82mg
1.847mg
0%
Lysine
0.478mg
1.664mg
0%
Methionine
0.129mg
0.286mg
0%
Phenylalanine
0.486mg
1.443mg
0%
Valine
0.547mg
1.237mg
0%
Histidine
0.243mg
0.695mg
0%
Macronutrient Comparison
Macronutrient breakdown side-by-side comparison
3
13%
6%
25%
43%
13%
Protein:
12.79 g
Fats:
6.01 g
Carbs:
25.37 g
Water:
43.02 g
Other:
12.81 g
2
24%
63%
9%
3%
Protein:
23.86 g
Fats:
1.15 g
Carbs:
62.62 g
Water:
9.05 g
Other:
3.32 g
Contains
more
Fats Fats
+422.6%
Contains
more
Water Water
+375.4%
Contains
more
Other Other
+285.8%
Contains
more
Protein Protein
+86.6%
Contains
more
Carbs Carbs
+146.8%
Fat Type Comparison
Fat type breakdown side-by-side comparison
2
20%
22%
57%
Saturated fat:
Sat. Fat
1.025 g
Monounsaturated fat:
Mono. Fat
1.118 g
Polyunsaturated fat:
Poly. Fat
2.884 g
1
39%
18%
43%
Saturated fat:
Sat. Fat
0.348 g
Monounsaturated fat:
Mono. Fat
0.161 g
Polyunsaturated fat:
Poly. Fat
0.384 g
Contains
more
Mono. Fat Monounsaturated fat
+594.4%
Contains
more
Poly. Fat Polyunsaturated fat
+651%
Contains
less
Sat. Fat Saturated fat
-66%