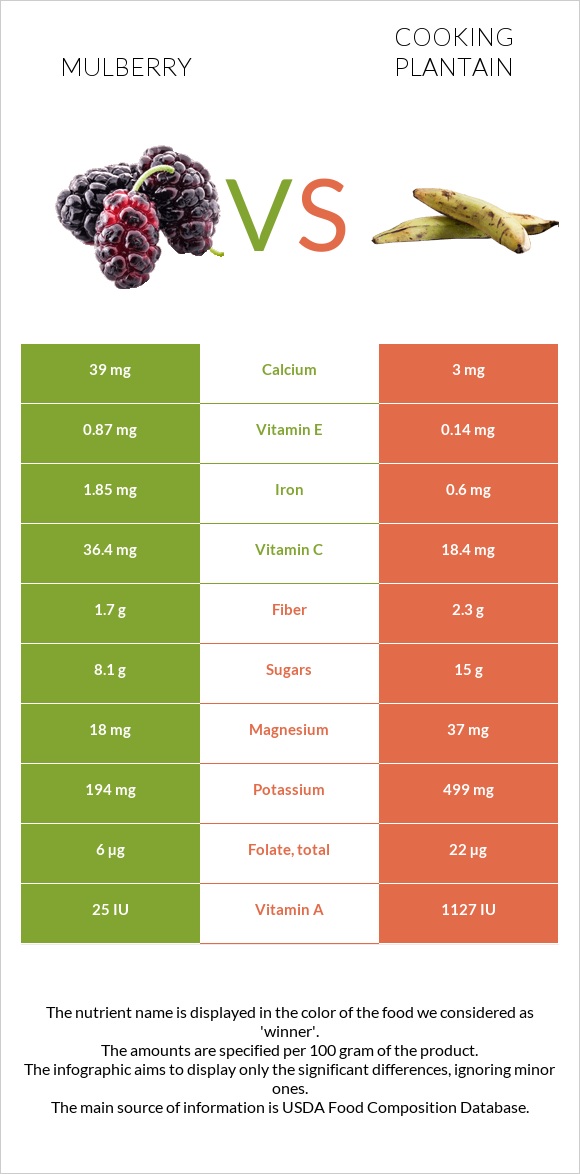
How are mulberries and plantains different? Mulberries are richer in vitamin C, iron, and vitamin K, while plantains are higher in vitamin A, vitamin B6, and potassium. Mulberries cover your daily need for vitamin C, 28% more than plantains. Mulberries contain 20 times more calcium than plantains. Mulberries contain 39mg of calcium, while plantains contain 2mg. Plantains have a higher glycemic index (37) than mulberries (25). Mulberries, raw and Plantains, cooked types were used in this article.
Infographic
Mineral Comparison
Mineral comparison score is based on the number of minerals by which one or the other food is richer. The "coverage" charts below show how much of the daily needs can be covered by 300 grams of the food.
3
100 g
300 g
10 fruit - 15g 1 cup - 140g
Magnesium
Magnesium
Calcium
Calcium
Potassium
Potassium
Iron
Iron
Copper
Copper
Zinc
Zinc
Phosphorus
Phosphorus
Sodium
Sodium
Manganese
Manganese
Selenium
Selenium
13%
12%
17%
69%
20%
3.3%
16%
1.3%
0%
3.3%
4
100 g
300 g
1 cup slices - 154g 1 cup, mashed - 200g
Magnesium
Magnesium
Calcium
Calcium
Potassium
Potassium
Iron
Iron
Copper
Copper
Zinc
Zinc
Phosphorus
Phosphorus
Sodium
Sodium
Manganese
Manganese
Selenium
Selenium
23%
0.6%
41%
22%
22%
3.5%
12%
0.65%
0%
7.6%
Vitamin Comparison
Vitamin comparison score is based on the number of vitamins by which one or the other food is richer. The "coverage" charts below show how much of the daily needs can be covered by 300 grams of the food.
4
100 g
300 g
10 fruit - 15g 1 cup - 140g
Vitamin C
Vit. C
Vitamin D
Vit. D
Vitamin A
Vit. A
Vitamin E
Vit. E
Vitamin B1
Vit. B1
Vitamin B2
Vit. B2
Vitamin B3
Vit. B3
Vitamin B5
Vit. B5
Vitamin B6
Vit. B6
Vitamin B12
Vit. B12
Vitamin K
Vit. K
Folate
Folate
121%
0%
0.33%
17%
7.3%
23%
12%
0%
12%
0%
20%
4.5%
6
100 g
300 g
1 cup slices - 154g 1 cup, mashed - 200g
Vitamin C
Vit. C
Vitamin D
Vit. D
Vitamin A
Vit. A
Vitamin E
Vit. E
Vitamin B1
Vit. B1
Vitamin B2
Vit. B2
Vitamin B3
Vit. B3
Vitamin B5
Vit. B5
Vitamin B6
Vit. B6
Vitamin B12
Vit. B12
Vitamin K
Vit. K
Folate
Folate
36%
0%
15%
2.6%
12%
12%
14%
14%
55%
0%
1.8%
20%
All nutrients comparison - raw data values
Nutrient
DV% diff.
Vitamin C
36.4mg
10.9mg
28%
Iron
1.85mg
0.58mg
16%
Vitamin B6
0.05mg
0.24mg
15%
Potassium
194mg
465mg
8%
Carbs
9.8g
31.15g
7%
Vitamin K
7.8µg
0.7µg
6%
Vitamin A
1µg
45µg
5%
Vitamin E
0.87mg
0.13mg
5%
Vitamin B5
0.233mg
5%
Folate
6µg
26µg
5%
Calories
43kcal
116kcal
4%
Calcium
39mg
2mg
4%
Vitamin B2
0.101mg
0.052mg
4%
Magnesium
18mg
32mg
3%
Fiber
1.7g
2.3g
2%
Protein
1.44g
0.79g
1%
Copper
0.06mg
0.066mg
1%
Phosphorus
38mg
28mg
1%
Selenium
0.6µg
1.4µg
1%
Vitamin B1
0.029mg
0.046mg
1%
Vitamin B3
0.62mg
0.756mg
1%
Polyunsaturated fat
0.207g
0.033g
1%
Protein per 100 calories
3.3g
0.68g
N/A
Calories per 10 g protein
299kcal
1468kcal
N/A
Weight per 100 calories
233g
86g
N/A
Fats
0.39g
0.18g
0%
Net carbs
8.1g
28.85g
N/A
Sugar
8.1g
14g
N/A
Zinc
0.12mg
0.13mg
0%
Sodium
10mg
5mg
0%
Choline
12.3mg
12.7mg
0%
Saturated fat
0.027g
0.069g
0%
Monounsaturated fat
0.041g
0.015g
0%
Tryptophan
0.009mg
0%
Threonine
0.021mg
0%
Isoleucine
0.022mg
0%
Leucine
0.036mg
0%
Lysine
0.037mg
0%
Methionine
0.01mg
0%
Phenylalanine
0.027mg
0%
Valine
0.028mg
0%
Histidine
0.039mg
0%
Macronutrient Comparison
Macronutrient breakdown side-by-side comparison
4
10%
88%
Protein:
1.44 g
Fats:
0.39 g
Carbs:
9.8 g
Water:
87.68 g
Other:
0.69 g
1
31%
67%
Protein:
0.79 g
Fats:
0.18 g
Carbs:
31.15 g
Water:
67.3 g
Other:
0.58 g
Contains
more
Protein Protein
+82.3%
Contains
more
Fats Fats
+116.7%
Contains
more
Water Water
+30.3%
Contains
more
Other Other
+19%
Contains
more
Carbs Carbs
+217.9%
Fat Type Comparison
Fat type breakdown side-by-side comparison
3
10%
15%
75%
Saturated fat:
Sat. Fat
0.027 g
Monounsaturated fat:
Mono. Fat
0.041 g
Polyunsaturated fat:
Poly. Fat
0.207 g
0
59%
13%
28%
Saturated fat:
Sat. Fat
0.069 g
Monounsaturated fat:
Mono. Fat
0.015 g
Polyunsaturated fat:
Poly. Fat
0.033 g
Contains
less
Sat. Fat Saturated fat
-60.9%
Contains
more
Mono. Fat Monounsaturated fat
+173.3%
Contains
more
Poly. Fat Polyunsaturated fat
+527.3%