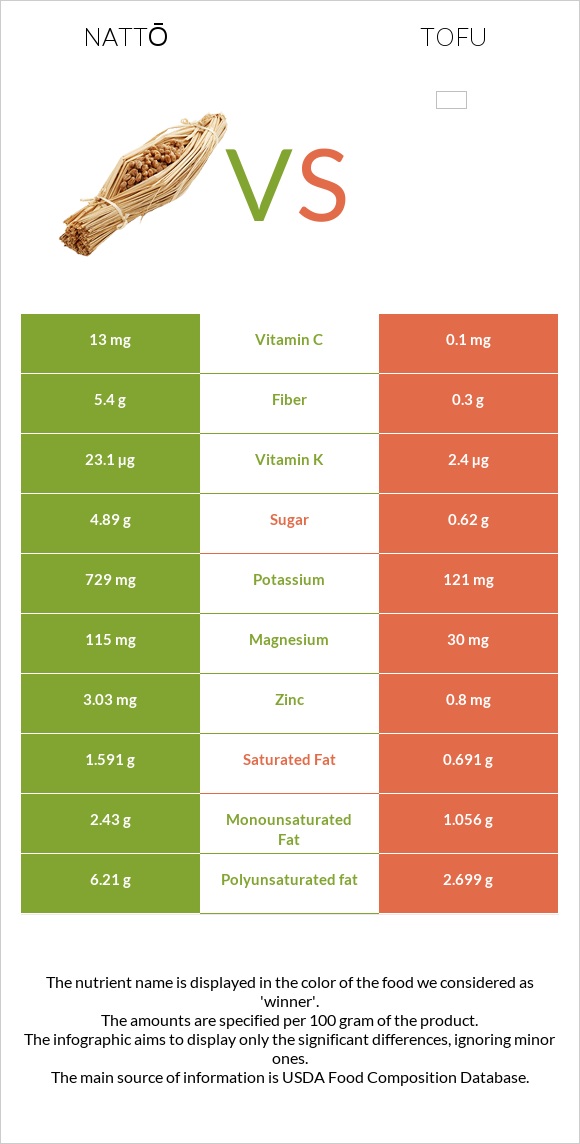
Significant differences between nattō and tofu Nattō has more copper, iron, manganese, fiber, zinc, magnesium, potassium, vitamin K, and vitamin C; however, tofu is richer in calcium. Nattō covers your daily copper needs 53% more than tofu. Tofu has 130 times less vitamin C than nattō. Nattō has 13mg of vitamin C, while tofu has 0.1mg. Nattō has a higher glycemic index. The glycemic index of nattō is 56, while the glycemic index of tofu is 15. Specific food types used in this comparison are Natto and Tofu, raw, regular, prepared with calcium sulfate .
Infographic
Mineral Comparison
Mineral comparison score is based on the number of minerals by which one or the other food is richer. The "coverage" charts below show how much of the daily needs can be covered by 300 grams of the food.
7
100 g
300 g
1 cup - 175g
Magnesium
Magnesium
Calcium
Calcium
Potassium
Potassium
Iron
Iron
Copper
Copper
Zinc
Zinc
Phosphorus
Phosphorus
Sodium
Sodium
Manganese
Manganese
Selenium
Selenium
82%
65%
64%
323%
222%
83%
75%
0.91%
199%
48%
1
100 g
300 g
0.25 block - 116g 0.5 cup - 124g
Magnesium
Magnesium
Calcium
Calcium
Potassium
Potassium
Iron
Iron
Copper
Copper
Zinc
Zinc
Phosphorus
Phosphorus
Sodium
Sodium
Manganese
Manganese
Selenium
Selenium
21%
105%
11%
201%
64%
22%
42%
0.91%
79%
49%
Vitamin Comparison
Vitamin comparison score is based on the number of vitamins by which one or the other food is richer. The "coverage" charts below show how much of the daily needs can be covered by 300 grams of the food.
6
100 g
300 g
1 cup - 175g
Vitamin C
Vit. C
Vitamin D
Vit. D
Vitamin A
Vit. A
Vitamin E
Vit. E
Vitamin B1
Vit. B1
Vitamin B2
Vit. B2
Vitamin B3
Vit. B3
Vitamin B5
Vit. B5
Vitamin B6
Vit. B6
Vitamin B12
Vit. B12
Vitamin K
Vit. K
Folate
Folate
43%
0%
0%
0.2%
40%
44%
0%
13%
30%
0%
58%
6%
2
100 g
300 g
0.25 block - 116g 0.5 cup - 124g
Vitamin C
Vit. C
Vitamin D
Vit. D
Vitamin A
Vit. A
Vitamin E
Vit. E
Vitamin B1
Vit. B1
Vitamin B2
Vit. B2
Vitamin B3
Vit. B3
Vitamin B5
Vit. B5
Vitamin B6
Vit. B6
Vitamin B12
Vit. B12
Vitamin K
Vit. K
Folate
Folate
0.33%
0%
0%
0.2%
20%
12%
3.7%
4.1%
11%
0%
6%
11%
All nutrients comparison - raw data values
Nutrient
DV% diff.
Copper
0.667mg
0.193mg
53%
Iron
8.6mg
5.36mg
41%
Manganese
1.528mg
0.605mg
40%
Protein
19.4g
8.08g
23%
Polyunsaturated fat
6.21g
2.699g
23%
Magnesium
115mg
30mg
20%
Fiber
5.4g
0.3g
20%
Zinc
3.03mg
0.8mg
20%
Potassium
729mg
121mg
18%
Vitamin K
23.1µg
2.4µg
17%
Vitamin C
13mg
0.1mg
14%
Calcium
217mg
350mg
13%
Phosphorus
174mg
97mg
11%
Vitamin B2
0.19mg
0.052mg
11%
Fats
11g
4.78g
10%
Calories
211kcal
76kcal
7%
Vitamin B1
0.16mg
0.081mg
7%
Vitamin B6
0.13mg
0.047mg
6%
Choline
57mg
28.8mg
5%
Carbs
12.68g
1.87g
4%
Saturated fat
1.591g
0.691g
4%
Vitamin B5
0.215mg
0.068mg
3%
Monounsaturated fat
2.43g
1.056g
3%
Folate
8µg
15µg
2%
Vitamin B3
0mg
0.195mg
1%
Protein per 100 calories
9.2g
11g
N/A
Calories per 10 g protein
109kcal
94kcal
N/A
Weight per 100 calories
47g
132g
N/A
Unsaturated / Saturated Fat ratio
5.4
5.4
N/A
Net carbs
7.28g
1.57g
N/A
Sugar
4.89g
0.62g
N/A
Sodium
7mg
7mg
0%
Vitamin E
0.01mg
0.01mg
0%
Selenium
8.8µg
8.9µg
0%
Tryptophan
0.223mg
0.12mg
0%
Threonine
0.813mg
0.402mg
0%
Isoleucine
0.931mg
0.435mg
0%
Leucine
1.509mg
0.713mg
0%
Lysine
1.145mg
0.452mg
0%
Methionine
0.208mg
0.108mg
0%
Phenylalanine
0.941mg
0.428mg
0%
Valine
1.018mg
0.446mg
0%
Histidine
0.512mg
0.221mg
0%
Macronutrient Comparison
Macronutrient breakdown side-by-side comparison
4
19%
11%
13%
55%
2%
Protein:
19.4 g
Fats:
11 g
Carbs:
12.68 g
Water:
55.02 g
Other:
1.9 g
1
8%
5%
2%
85%
Protein:
8.08 g
Fats:
4.78 g
Carbs:
1.87 g
Water:
84.55 g
Other:
0.72 g
Contains
more
Protein Protein
+140.1%
Contains
more
Fats Fats
+130.1%
Contains
more
Carbs Carbs
+578.1%
Contains
more
Other Other
+163.9%
Contains
more
Water Water
+53.7%
Fat Type Comparison
Fat type breakdown side-by-side comparison
2
16%
24%
61%
Saturated fat:
Sat. Fat
1.591 g
Monounsaturated fat:
Mono. Fat
2.43 g
Polyunsaturated fat:
Poly. Fat
6.21 g
1
16%
24%
61%
Saturated fat:
Sat. Fat
0.691 g
Monounsaturated fat:
Mono. Fat
1.056 g
Polyunsaturated fat:
Poly. Fat
2.699 g
Contains
more
Mono. Fat Monounsaturated fat
+130.1%
Contains
more
Poly. Fat Polyunsaturated fat
+130.1%
Contains
less
Sat. Fat Saturated fat
-56.6%