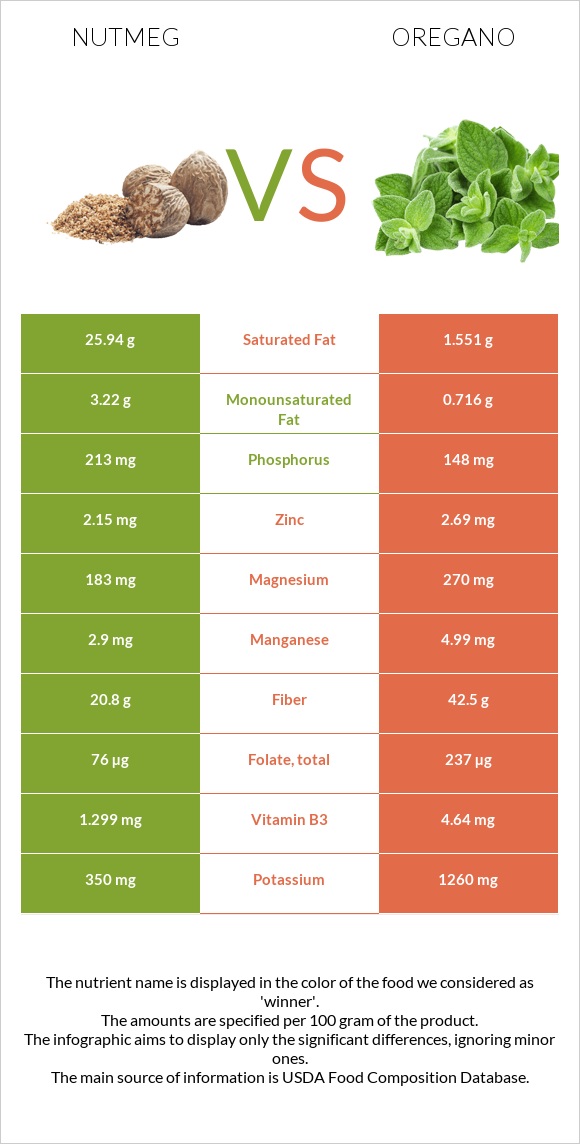
Important differences between nutmeg and oregano Nutmeg has more copper; however, oregano has more vitamin K, iron, calcium, vitamin E, manganese, fiber, vitamin B6, and folate. Oregano's daily need coverage for vitamin K is 518% more. Nutmeg has 17 times more saturated fat than oregano. Nutmeg has 25.94g of saturated fat, while oregano has 1.551g. The food varieties used in the comparison are Spices, nutmeg, ground and Spices, oregano, dried .
Infographic
Mineral Comparison
Mineral comparison score is based on the number of minerals by which one or the other food is richer. The "coverage" charts below show how much of the daily needs can be covered by 300 grams of the food.
3
100 g
300 g
0.25 tsp - 0.5g 1 tbsp - 7g
Magnesium
Magnesium
Calcium
Calcium
Potassium
Potassium
Iron
Iron
Copper
Copper
Zinc
Zinc
Phosphorus
Phosphorus
Sodium
Sodium
Manganese
Manganese
Selenium
Selenium
131%
55%
31%
114%
342%
59%
91%
2.1%
378%
8.7%
7
100 g
300 g
0.25 tsp - 0.5g 1 tsp, ground - 1.8g
Magnesium
Magnesium
Calcium
Calcium
Potassium
Potassium
Iron
Iron
Copper
Copper
Zinc
Zinc
Phosphorus
Phosphorus
Sodium
Sodium
Manganese
Manganese
Selenium
Selenium
193%
479%
111%
1380%
211%
73%
63%
3.3%
651%
25%
Vitamin Comparison
Vitamin comparison score is based on the number of vitamins by which one or the other food is richer. The "coverage" charts below show how much of the daily needs can be covered by 300 grams of the food.
2
100 g
300 g
0.25 tsp - 0.5g 1 tbsp - 7g
Vitamin C
Vit. C
Vitamin D
Vit. D
Vitamin A
Vit. A
Vitamin E
Vit. E
Vitamin B1
Vit. B1
Vitamin B2
Vit. B2
Vitamin B3
Vit. B3
Vitamin B5
Vit. B5
Vitamin B6
Vit. B6
Vitamin B12
Vit. B12
Vitamin K
Vit. K
Folate
Folate
10%
0%
1.7%
0%
87%
13%
24%
0%
37%
0%
0%
57%
8
100 g
300 g
0.25 tsp - 0.5g 1 tsp, ground - 1.8g
Vitamin C
Vit. C
Vitamin D
Vit. D
Vitamin A
Vit. A
Vitamin E
Vit. E
Vitamin B1
Vit. B1
Vitamin B2
Vit. B2
Vitamin B3
Vit. B3
Vitamin B5
Vit. B5
Vitamin B6
Vit. B6
Vitamin B12
Vit. B12
Vitamin K
Vit. K
Folate
Folate
7.7%
0%
28%
365%
44%
122%
87%
55%
241%
0%
1554%
178%
All nutrients comparison - raw data values
Nutrient
DV% diff.
Vitamin K
0µg
621.7µg
518%
Iron
3.04mg
36.8mg
422%
Calcium
184mg
1597mg
141%
Vitamin E
0mg
18.26mg
122%
Saturated fat
25.94g
1.551g
111%
Manganese
2.9mg
4.99mg
91%
Fiber
20.8g
42.5g
87%
Vitamin B6
0.16mg
1.044mg
68%
Fats
36.31g
4.28g
49%
Copper
1.027mg
0.633mg
44%
Folate
76µg
237µg
40%
Vitamin B2
0.057mg
0.528mg
36%
Potassium
350mg
1260mg
27%
Magnesium
183mg
270mg
21%
Vitamin B3
1.299mg
4.64mg
21%
Vitamin B5
0.921mg
18%
Vitamin B1
0.346mg
0.177mg
14%
Calories
525kcal
265kcal
13%
Phosphorus
213mg
148mg
9%
Vitamin A
5µg
85µg
9%
Carbs
49.29g
68.92g
7%
Polyunsaturated fat
0.35g
1.369g
7%
Protein
5.84g
9g
6%
Monounsaturated fat
3.22g
0.716g
6%
Zinc
2.15mg
2.69mg
5%
Selenium
1.6µg
4.5µg
5%
Choline
8.8mg
32.3mg
4%
Vitamin C
3mg
2.3mg
1%
Fructose
1.13g
1%
Protein per 100 calories
1.1g
3.4g
N/A
Calories per 10 g protein
899kcal
294kcal
N/A
Weight per 100 calories
19g
38g
N/A
Unsaturated / Saturated Fat ratio
0.14
1.3
N/A
Net carbs
28.49g
26.42g
N/A
Sugar
2.99g
4.09g
N/A
Sodium
16mg
25mg
0%
Tryptophan
0.203mg
0%
Threonine
0.322mg
0%
Isoleucine
0.441mg
0%
Leucine
0.78mg
0%
Lysine
0.5mg
0%
Methionine
0.127mg
0%
Phenylalanine
0.449mg
0%
Valine
0.585mg
0%
Histidine
0.144mg
0%
Omega-3 - ALA
0.621g
N/A
Macronutrient Comparison
Macronutrient breakdown side-by-side comparison
1
6%
36%
49%
6%
2%
Protein:
5.84 g
Fats:
36.31 g
Carbs:
49.29 g
Water:
6.23 g
Other:
2.33 g
4
9%
4%
69%
10%
8%
Protein:
9 g
Fats:
4.28 g
Carbs:
68.92 g
Water:
9.93 g
Other:
7.87 g
Contains
more
Fats Fats
+748.4%
Contains
more
Protein Protein
+54.1%
Contains
more
Carbs Carbs
+39.8%
Contains
more
Water Water
+59.4%
Contains
more
Other Other
+237.8%
Fat Type Comparison
Fat type breakdown side-by-side comparison
1
88%
11%
Saturated fat:
Sat. Fat
25.94 g
Monounsaturated fat:
Mono. Fat
3.22 g
Polyunsaturated fat:
Poly. Fat
0.35 g
2
43%
20%
38%
Saturated fat:
Sat. Fat
1.551 g
Monounsaturated fat:
Mono. Fat
0.716 g
Polyunsaturated fat:
Poly. Fat
1.369 g
Contains
more
Mono. Fat Monounsaturated fat
+349.7%
Contains
less
Sat. Fat Saturated fat
-94%
Contains
more
Poly. Fat Polyunsaturated fat
+291.1%