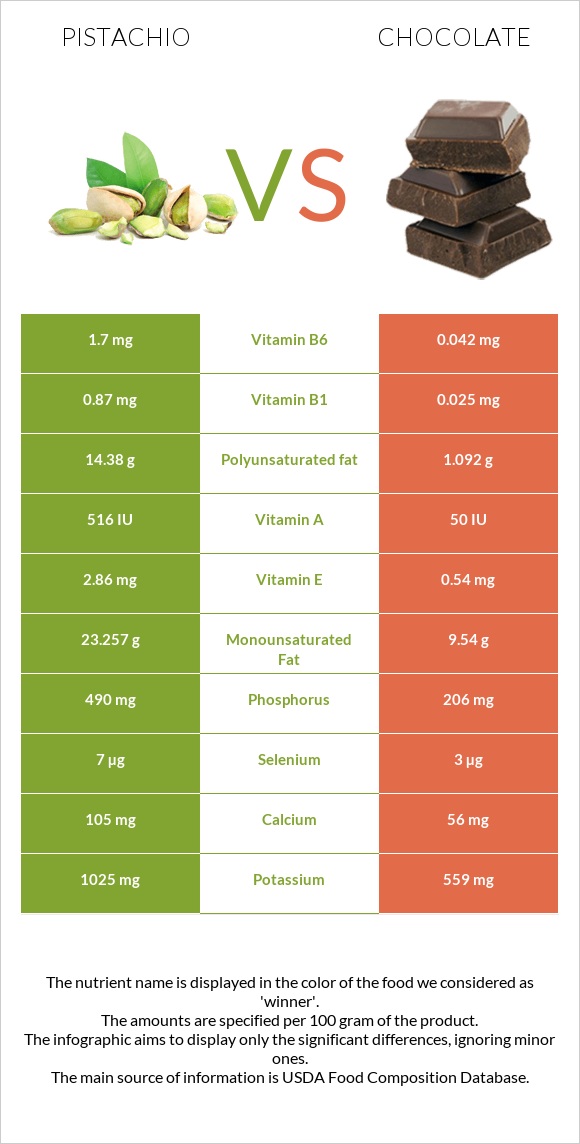
Summary of differences between pistachios and chocolate Pistachios have more vitamin B6, vitamin B1, phosphorus, copper, vitamin E, fiber, and potassium, while chocolate has more iron and vitamin B12. Pistachios cover your daily need for vitamin B6, 128% more than chocolate. Pistachios contain 35 times more vitamin B1 than chocolate. While pistachios contain 0.87mg of vitamin B1, chocolate contains only 0.025mg. The amount of saturated fat in pistachios is lower. These are the specific foods used in this comparison Nuts, pistachio nuts, raw and Chocolate, dark, 45- 59% cacao solids .
Infographic
Mineral Comparison
Mineral comparison score is based on the number of minerals by which one or the other food is richer. The "coverage" charts below show how much of the daily needs can be covered by 300 grams of the food.
6
100 g
300 g
1 kernel - 0.7g 1 oz (49 kernels) - 28.35g 1 cup - 123g
Magnesium
Magnesium
Calcium
Calcium
Potassium
Potassium
Iron
Iron
Copper
Copper
Zinc
Zinc
Phosphorus
Phosphorus
Sodium
Sodium
Manganese
Manganese
Selenium
Selenium
86%
32%
90%
147%
433%
60%
210%
0.13%
157%
38%
3
100 g
300 g
1 oz - 28.35g 1 bar - 162g
Magnesium
Magnesium
Calcium
Calcium
Potassium
Potassium
Iron
Iron
Copper
Copper
Zinc
Zinc
Phosphorus
Phosphorus
Sodium
Sodium
Manganese
Manganese
Selenium
Selenium
104%
17%
49%
301%
343%
55%
88%
3.1%
185%
16%
Vitamin Comparison
Vitamin comparison score is based on the number of vitamins by which one or the other food is richer. The "coverage" charts below show how much of the daily needs can be covered by 300 grams of the food.
9
100 g
300 g
1 kernel - 0.7g 1 oz (49 kernels) - 28.35g 1 cup - 123g
Vitamin C
Vit. C
Vitamin D
Vit. D
Vitamin A
Vit. A
Vitamin E
Vit. E
Vitamin B1
Vit. B1
Vitamin B2
Vit. B2
Vitamin B3
Vit. B3
Vitamin B5
Vit. B5
Vitamin B6
Vit. B6
Vitamin B12
Vit. B12
Vitamin K
Vit. K
Folate
Folate
19%
0%
8.7%
57%
218%
37%
24%
31%
392%
0%
0%
38%
2
100 g
300 g
1 oz - 28.35g 1 bar - 162g
Vitamin C
Vit. C
Vitamin D
Vit. D
Vitamin A
Vit. A
Vitamin E
Vit. E
Vitamin B1
Vit. B1
Vitamin B2
Vit. B2
Vitamin B3
Vit. B3
Vitamin B5
Vit. B5
Vitamin B6
Vit. B6
Vitamin B12
Vit. B12
Vitamin K
Vit. K
Folate
Folate
0%
0%
0.67%
11%
6.3%
12%
14%
18%
9.7%
29%
20%
0%
All nutrients comparison - raw data values
Nutrient
DV% diff.
Vitamin B6
1.7mg
0.042mg
128%
Polyunsaturated fat
14.38g
1.092g
89%
Vitamin B1
0.87mg
0.025mg
70%
Saturated fat
5.907g
18.519g
57%
Iron
3.92mg
8.02mg
51%
Phosphorus
490mg
206mg
41%
Monounsaturated fat
23.257g
9.54g
34%
Protein
20.16g
4.88g
31%
Copper
1.3mg
1.028mg
30%
Fats
45.32g
31.28g
22%
Vitamin E
2.86mg
0.54mg
15%
Potassium
1025mg
559mg
14%
Fiber
10.6g
7g
14%
Folate
51µg
13%
Carbs
27.17g
61.17g
11%
Caffeine
0mg
43mg
11%
Manganese
1.2mg
1.419mg
10%
Vitamin B12
0µg
0.23µg
10%
Vitamin B2
0.16mg
0.05mg
8%
Selenium
7µg
3µg
7%
Vitamin K
8.1µg
7%
Vitamin C
5.6mg
6%
Magnesium
121mg
146mg
6%
Calcium
105mg
56mg
5%
Vitamin B3
1.3mg
0.725mg
4%
Vitamin B5
0.52mg
0.297mg
4%
Cholesterol
0mg
8mg
3%
Vitamin A
26µg
2µg
3%
Zinc
2.2mg
2.01mg
2%
Calories
560kcal
546kcal
1%
Starch
1.67g
1%
Sodium
1mg
24mg
1%
Protein per 100 calories
3.6g
0.89g
N/A
Calories per 10 g protein
278kcal
1119kcal
N/A
Weight per 100 calories
18g
18g
N/A
Unsaturated / Saturated Fat ratio
6.4
0.57
N/A
Net carbs
16.57g
54.17g
N/A
Sugar
7.66g
47.9g
N/A
Trans fat
0g
0.112g
N/A
Tryptophan
0.251mg
0%
Threonine
0.684mg
0%
Isoleucine
0.917mg
0%
Leucine
1.604mg
0%
Lysine
1.138mg
0%
Methionine
0.36mg
0%
Phenylalanine
1.092mg
0%
Valine
1.249mg
0%
Histidine
0.512mg
0%
Fructose
0.24g
0g
0%
Omega-3 - EPA
0g
0.001g
N/A
Omega-3 - ALA
0.085g
N/A
Omega-6 - Eicosadienoic acid
0g
0.001g
N/A
Omega-6 - Linoleic acid
14.091g
0.947g
N/A
Macronutrient Comparison
Macronutrient breakdown side-by-side comparison
4
20%
45%
27%
4%
3%
Protein:
20.16 g
Fats:
45.32 g
Carbs:
27.17 g
Water:
4.37 g
Other:
2.98 g
1
5%
31%
61%
2%
Protein:
4.88 g
Fats:
31.28 g
Carbs:
61.17 g
Water:
0.97 g
Other:
1.7 g
Contains
more
Protein Protein
+313.1%
Contains
more
Fats Fats
+44.9%
Contains
more
Water Water
+350.5%
Contains
more
Other Other
+75.3%
Contains
more
Carbs Carbs
+125.1%
Fat Type Comparison
Fat type breakdown side-by-side comparison
3
14%
53%
33%
Saturated fat:
Sat. Fat
5.907 g
Monounsaturated fat:
Mono. Fat
23.257 g
Polyunsaturated fat:
Poly. Fat
14.38 g
0
64%
33%
4%
Saturated fat:
Sat. Fat
18.519 g
Monounsaturated fat:
Mono. Fat
9.54 g
Polyunsaturated fat:
Poly. Fat
1.092 g
Contains
less
Sat. Fat Saturated fat
-68.1%
Contains
more
Mono. Fat Monounsaturated fat
+143.8%
Contains
more
Poly. Fat Polyunsaturated fat
+1216.8%
Carbohydrate type comparison
Carbohydrate type breakdown side-by-side comparison
4
18%
74%
3%
3%
2%
Starch:
1.67 g
Sucrose:
6.87 g
Glucose:
0.32 g
Fructose:
0.24 g
Lactose:
0 g
Maltose:
0.17 g
Galactose:
0 g
2
97%
3%
Starch:
0 g
Sucrose:
46.25 g
Glucose:
0 g
Fructose:
0 g
Lactose:
1.65 g
Maltose:
0 g
Galactose:
0 g
Contains
more
Starch Starch
+∞%
Contains
more
Glucose Glucose
+∞%
Contains
more
Fructose Fructose
+∞%
Contains
more
Maltose Maltose
+∞%
Contains
more
Sucrose Sucrose
+573.2%
Contains
more
Lactose Lactose
+∞%