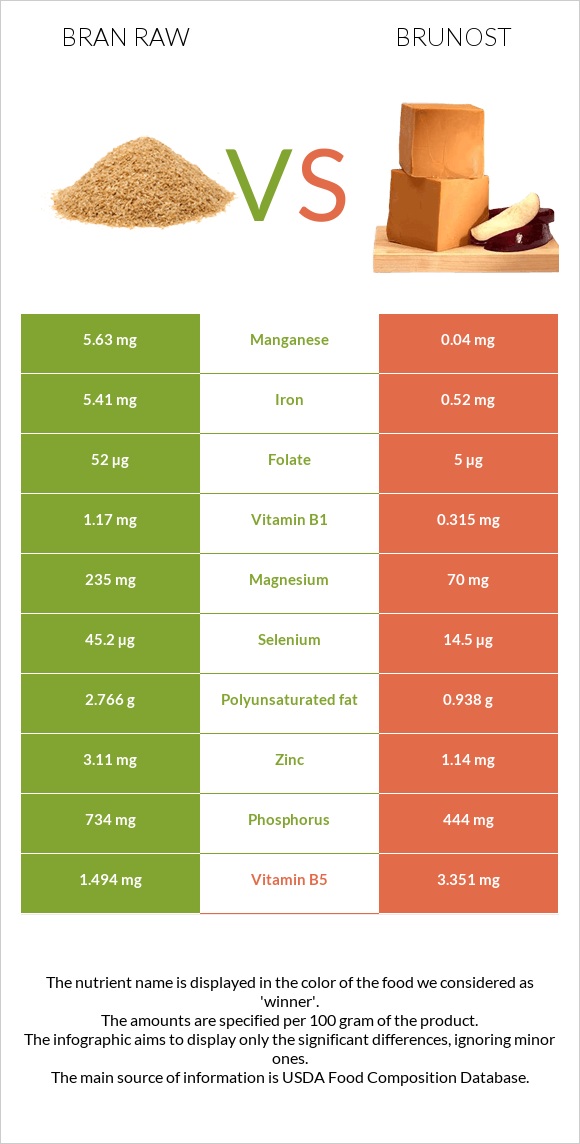
The main differences between bran raw and brunost Bran raw has more manganese, vitamin B1, fiber, iron, selenium, phosphorus, and magnesium; however, brunost has more vitamin B12 and vitamin B2. Daily need coverage for manganese for bran raw is 243% higher. Bran raw is lower in saturated fat. Bran raw has a higher glycemic index than brunost. Food types used in this article are Oat bran, raw and Cheese, gjetost .
Infographic
Mineral Comparison
Mineral comparison score is based on the number of minerals by which one or the other food is richer. The "coverage" charts below show how much of the daily needs can be covered by 300 grams of the food.
8
100 g
300 g
1 cup - 94g
Magnesium
Magnesium
Calcium
Calcium
Potassium
Potassium
Iron
Iron
Copper
Copper
Zinc
Zinc
Phosphorus
Phosphorus
Sodium
Sodium
Manganese
Manganese
Selenium
Selenium
168%
17%
50%
203%
134%
85%
315%
0.52%
734%
247%
2
100 g
300 g
1 oz - 28.35g 1 package (8 oz) - 227g
Magnesium
Magnesium
Calcium
Calcium
Potassium
Potassium
Iron
Iron
Copper
Copper
Zinc
Zinc
Phosphorus
Phosphorus
Sodium
Sodium
Manganese
Manganese
Selenium
Selenium
50%
120%
124%
20%
27%
31%
190%
78%
5.2%
79%
Vitamin Comparison
Vitamin comparison score is based on the number of vitamins by which one or the other food is richer. The "coverage" charts below show how much of the daily needs can be covered by 300 grams of the food.
5
100 g
300 g
1 cup - 94g
Vitamin C
Vit. C
Vitamin D
Vit. D
Vitamin A
Vit. A
Vitamin E
Vit. E
Vitamin B1
Vit. B1
Vitamin B2
Vit. B2
Vitamin B3
Vit. B3
Vitamin B5
Vit. B5
Vitamin B6
Vit. B6
Vitamin B12
Vit. B12
Vitamin K
Vit. K
Folate
Folate
0%
0%
0%
20%
293%
51%
18%
90%
38%
0%
8%
39%
5
100 g
300 g
1 oz - 28.35g 1 package (8 oz) - 227g
Vitamin C
Vit. C
Vitamin D
Vit. D
Vitamin A
Vit. A
Vitamin E
Vit. E
Vitamin B1
Vit. B1
Vitamin B2
Vit. B2
Vitamin B3
Vit. B3
Vitamin B5
Vit. B5
Vitamin B6
Vit. B6
Vitamin B12
Vit. B12
Vitamin K
Vit. K
Folate
Folate
0%
0%
111%
0%
79%
319%
15%
201%
63%
303%
0%
3.8%
All nutrients comparison - raw data values
Nutrient
DV% diff.
Manganese
5.63mg
0.04mg
243%
Vitamin B12
0µg
2.42µg
101%
Vitamin B2
0.22mg
1.382mg
89%
Saturated fat
1.328g
19.16g
81%
Vitamin B1
1.17mg
0.315mg
71%
Fiber
15.4g
0g
62%
Iron
5.41mg
0.52mg
61%
Selenium
45.2µg
14.5µg
56%
Phosphorus
734mg
444mg
41%
Magnesium
235mg
70mg
39%
Vitamin A
0µg
334µg
37%
Vitamin B5
1.494mg
3.351mg
37%
Copper
0.403mg
0.08mg
36%
Fats
7.03g
29.51g
35%
Calcium
58mg
400mg
34%
Cholesterol
0mg
94mg
31%
Sodium
4mg
600mg
26%
Potassium
566mg
1409mg
25%
Zinc
3.11mg
1.14mg
18%
Protein
17.3g
9.65g
15%
Monounsaturated fat
2.376g
7.879g
14%
Folate
52µg
5µg
12%
Polyunsaturated fat
2.766g
0.938g
12%
Calories
246kcal
466kcal
11%
Carbs
66.22g
42.65g
8%
Vitamin B6
0.165mg
0.271mg
8%
Vitamin E
1.01mg
7%
Choline
32.2mg
6%
Vitamin K
3.2µg
3%
Vitamin B3
0.934mg
0.813mg
1%
Protein per 100 calories
7g
2.1g
N/A
Calories per 10 g protein
142kcal
483kcal
N/A
Weight per 100 calories
41g
21g
N/A
Unsaturated / Saturated Fat ratio
3.9
0.46
N/A
Net carbs
50.82g
42.65g
N/A
Sugar
1.45g
N/A
Tryptophan
0.335mg
0.135mg
0%
Threonine
0.502mg
0.393mg
0%
Isoleucine
0.668mg
0.519mg
0%
Leucine
1.374mg
0.992mg
0%
Lysine
0.76mg
0.814mg
0%
Methionine
0.335mg
0.318mg
0%
Phenylalanine
0.908mg
0.54mg
0%
Valine
0.964mg
0.765mg
0%
Histidine
0.41mg
0.293mg
0%
Macronutrient Comparison
Macronutrient breakdown side-by-side comparison
2
17%
7%
66%
7%
3%
Protein:
17.3 g
Fats:
7.03 g
Carbs:
66.22 g
Water:
6.55 g
Other:
2.9 g
3
10%
30%
43%
13%
5%
Protein:
9.65 g
Fats:
29.51 g
Carbs:
42.65 g
Water:
13.44 g
Other:
4.75 g
Contains
more
Protein Protein
+79.3%
Contains
more
Carbs Carbs
+55.3%
Contains
more
Fats Fats
+319.8%
Contains
more
Water Water
+105.2%
Contains
more
Other Other
+63.8%
Fat Type Comparison
Fat type breakdown side-by-side comparison
2
21%
37%
43%
Saturated fat:
Sat. Fat
1.328 g
Monounsaturated fat:
Mono. Fat
2.376 g
Polyunsaturated fat:
Poly. Fat
2.766 g
1
68%
28%
3%
Saturated fat:
Sat. Fat
19.16 g
Monounsaturated fat:
Mono. Fat
7.879 g
Polyunsaturated fat:
Poly. Fat
0.938 g
Contains
less
Sat. Fat Saturated fat
-93.1%
Contains
more
Poly. Fat Polyunsaturated fat
+194.9%
Contains
more
Mono. Fat Monounsaturated fat
+231.6%