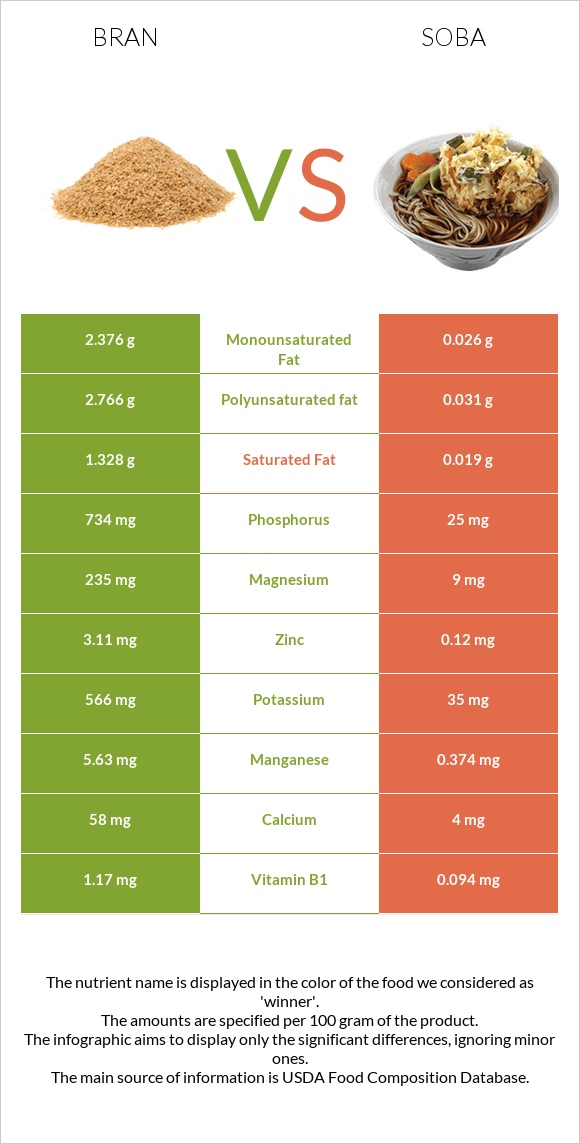
How are bran and soba different? Bran has more manganese, phosphorus, magnesium, copper, and vitamin B1 than soba. Daily need coverage for manganese for bran is 26% higher. Bran contains 8 times more copper than soba. While bran contains 0.066mg of copper, soba contains only 0.008mg. Oat bran, cooked and Noodles, japanese, soba, cooked are the varieties used in this article.
Infographic
Mineral Comparison
Mineral comparison score is based on the number of minerals by which one or the other food is richer. The "coverage" charts below show how much of the daily needs can be covered by 300 grams of the food.
10
100 g
300 g
1 cup - 219g
Magnesium
Magnesium
Calcium
Calcium
Potassium
Potassium
Iron
Iron
Copper
Copper
Zinc
Zinc
Phosphorus
Phosphorus
Sodium
Sodium
Manganese
Manganese
Selenium
Selenium
29%
3%
8.1%
33%
22%
14%
51%
0.13%
126%
42%
0
100 g
300 g
1 cup - 114g
Magnesium
Magnesium
Calcium
Calcium
Potassium
Potassium
Iron
Iron
Copper
Copper
Zinc
Zinc
Phosphorus
Phosphorus
Sodium
Sodium
Manganese
Manganese
Selenium
Selenium
6.4%
1.2%
3.1%
18%
2.7%
3.3%
11%
7.8%
49%
0%
Vitamin Comparison
Vitamin comparison score is based on the number of vitamins by which one or the other food is richer. The "coverage" charts below show how much of the daily needs can be covered by 300 grams of the food.
2
100 g
300 g
1 cup - 219g
Vitamin C
Vit. C
Vitamin D
Vit. D
Vitamin A
Vit. A
Vitamin E
Vit. E
Vitamin B1
Vit. B1
Vitamin B2
Vit. B2
Vitamin B3
Vit. B3
Vitamin B5
Vit. B5
Vitamin B6
Vit. B6
Vitamin B12
Vit. B12
Vitamin K
Vit. K
Folate
Folate
0%
0%
0%
0%
40%
7.8%
2.7%
13%
5.8%
0%
0%
4.5%
3
100 g
300 g
1 cup - 114g
Vitamin C
Vit. C
Vitamin D
Vit. D
Vitamin A
Vit. A
Vitamin E
Vit. E
Vitamin B1
Vit. B1
Vitamin B2
Vit. B2
Vitamin B3
Vit. B3
Vitamin B5
Vit. B5
Vitamin B6
Vit. B6
Vitamin B12
Vit. B12
Vitamin K
Vit. K
Folate
Folate
0%
0%
0%
0%
24%
6%
9.6%
14%
9.2%
0%
0%
5.3%
All nutrients comparison - raw data values
Nutrient
DV% diff.
Manganese
0.964mg
0.374mg
26%
Selenium
7.7µg
14%
Phosphorus
119mg
25mg
13%
Fiber
2.6g
10%
Magnesium
40mg
9mg
7%
Copper
0.066mg
0.008mg
6%
Vitamin B1
0.16mg
0.094mg
6%
Iron
0.88mg
0.48mg
5%
Protein
3.21g
5.06g
4%
Zinc
0.53mg
0.12mg
4%
Calories
40kcal
99kcal
3%
Carbs
11.44g
21.44g
3%
Sodium
1mg
60mg
3%
Potassium
92mg
35mg
2%
Vitamin B3
0.144mg
0.51mg
2%
Polyunsaturated fat
0.339g
0.031g
2%
Fats
0.86g
0.1g
1%
Calcium
10mg
4mg
1%
Vitamin B2
0.034mg
0.026mg
1%
Vitamin B6
0.025mg
0.04mg
1%
Saturated fat
0.163g
0.019g
1%
Monounsaturated fat
0.291g
0.026g
1%
Protein per 100 calories
8g
5.1g
N/A
Calories per 10 g protein
125kcal
196kcal
N/A
Weight per 100 calories
250g
101g
N/A
Net carbs
8.84g
21.44g
N/A
Vitamin B5
0.217mg
0.235mg
0%
Folate
6µg
7µg
0%
Tryptophan
0.057mg
0.072mg
0%
Threonine
0.086mg
0.177mg
0%
Isoleucine
0.114mg
0.195mg
0%
Leucine
0.235mg
0.33mg
0%
Lysine
0.13mg
0.214mg
0%
Methionine
0.057mg
0.072mg
0%
Phenylalanine
0.155mg
0.217mg
0%
Valine
0.165mg
0.249mg
0%
Histidine
0.07mg
0.119mg
0%
Macronutrient Comparison
Macronutrient breakdown side-by-side comparison
3
3%
11%
84%
Protein:
3.21 g
Fats:
0.86 g
Carbs:
11.44 g
Water:
84 g
Other:
0.49 g
2
5%
21%
73%
Protein:
5.06 g
Fats:
0.1 g
Carbs:
21.44 g
Water:
73.01 g
Other:
0.39 g
Contains
more
Fats Fats
+760%
Contains
more
Water Water
+15.1%
Contains
more
Other Other
+25.6%
Contains
more
Protein Protein
+57.6%
Contains
more
Carbs Carbs
+87.4%
Fat Type Comparison
Fat type breakdown side-by-side comparison
2
21%
37%
43%
Saturated fat:
Sat. Fat
0.163 g
Monounsaturated fat:
Mono. Fat
0.291 g
Polyunsaturated fat:
Poly. Fat
0.339 g
1
25%
34%
41%
Saturated fat:
Sat. Fat
0.019 g
Monounsaturated fat:
Mono. Fat
0.026 g
Polyunsaturated fat:
Poly. Fat
0.031 g
Contains
more
Mono. Fat Monounsaturated fat
+1019.2%
Contains
more
Poly. Fat Polyunsaturated fat
+993.5%
Contains
less
Sat. Fat Saturated fat
-88.3%