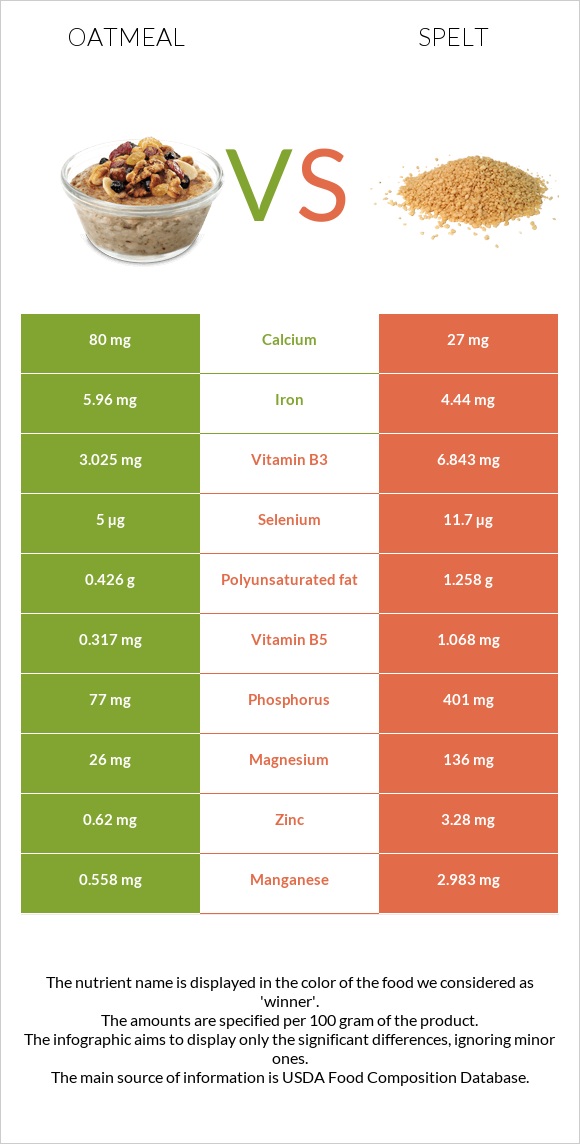
Summary of differences between oatmeal and spelt Oatmeal has more iron, while spelt has more manganese, copper, phosphorus, fiber, magnesium, zinc, vitamin B3, vitamin B5, and selenium. Spelt covers your daily need for manganese, 105% more than oatmeal. Spelt has a lower glycemic index. The glycemic index of spelt is 63, while the glycemic index of oatmeal is 79. These are the specific foods used in this comparison Cereals, oats, instant, fortified, plain, prepared with water (boiling water added or microwaved) and Spelt, uncooked .
Infographic
Mineral Comparison
Mineral comparison score is based on the number of minerals by which one or the other food is richer. The "coverage" charts below show how much of the daily needs can be covered by 300 grams of the food.
2
100 g
300 g
1 oz, dry, yields - 177g 1 packet, dry, yields - 177g 1 cup, cooked - 234g 1 cup, dry, yields - 501g
Magnesium
Magnesium
Calcium
Calcium
Potassium
Potassium
Iron
Iron
Copper
Copper
Zinc
Zinc
Phosphorus
Phosphorus
Sodium
Sodium
Manganese
Manganese
Selenium
Selenium
19%
24%
5.4%
224%
22%
17%
33%
6.4%
73%
27%
8
100 g
300 g
1 cup - 174g
Magnesium
Magnesium
Calcium
Calcium
Potassium
Potassium
Iron
Iron
Copper
Copper
Zinc
Zinc
Phosphorus
Phosphorus
Sodium
Sodium
Manganese
Manganese
Selenium
Selenium
97%
8.1%
34%
167%
170%
89%
172%
1%
389%
64%
Vitamin Comparison
Vitamin comparison score is based on the number of vitamins by which one or the other food is richer. The "coverage" charts below show how much of the daily needs can be covered by 300 grams of the food.
3
100 g
300 g
1 oz, dry, yields - 177g 1 packet, dry, yields - 177g 1 cup, cooked - 234g 1 cup, dry, yields - 501g
Vitamin C
Vit. C
Vitamin D
Vit. D
Vitamin A
Vit. A
Vitamin E
Vit. E
Vitamin B1
Vit. B1
Vitamin B2
Vit. B2
Vitamin B3
Vit. B3
Vitamin B5
Vit. B5
Vitamin B6
Vit. B6
Vitamin B12
Vit. B12
Vitamin K
Vit. K
Folate
Folate
0%
0%
43%
1.4%
65%
50%
57%
19%
67%
0%
1%
33%
5
100 g
300 g
1 cup - 174g
Vitamin C
Vit. C
Vitamin D
Vit. D
Vitamin A
Vit. A
Vitamin E
Vit. E
Vitamin B1
Vit. B1
Vitamin B2
Vit. B2
Vitamin B3
Vit. B3
Vitamin B5
Vit. B5
Vitamin B6
Vit. B6
Vitamin B12
Vit. B12
Vitamin K
Vit. K
Folate
Folate
0%
0%
0%
16%
91%
26%
128%
64%
53%
0%
9%
34%
All nutrients comparison - raw data values
Nutrient
DV% diff.
Manganese
0.558mg
2.983mg
105%
Copper
0.066mg
0.511mg
49%
Phosphorus
77mg
401mg
46%
Fiber
1.7g
10.7g
36%
Magnesium
26mg
136mg
26%
Protein
2.37g
14.57g
24%
Zinc
0.62mg
3.28mg
24%
Vitamin B3
3.025mg
6.843mg
24%
Carbs
11.67g
70.19g
20%
Iron
5.96mg
4.44mg
19%
Starch
10.37g
53.92g
18%
Vitamin B5
0.317mg
1.068mg
15%
Calories
68kcal
338kcal
14%
Vitamin A
130µg
0µg
14%
Selenium
5µg
11.7µg
12%
Potassium
61mg
388mg
10%
Vitamin B1
0.26mg
0.364mg
9%
Vitamin B2
0.215mg
0.113mg
8%
Polyunsaturated fat
0.426g
1.258g
6%
Calcium
80mg
27mg
5%
Vitamin E
0.07mg
0.79mg
5%
Vitamin B6
0.29mg
0.23mg
5%
Vitamin K
0.4µg
3.6µg
3%
Fats
1.36g
2.43g
2%
Sodium
49mg
8mg
2%
Choline
4.7mg
1%
Saturated fat
0.226g
0.406g
1%
Protein per 100 calories
3.5g
4.3g
N/A
Calories per 10 g protein
287kcal
232kcal
N/A
Weight per 100 calories
147g
30g
N/A
Unsaturated / Saturated Fat ratio
3.6
4.2
N/A
Net carbs
9.97g
59.49g
N/A
Sugar
0.46g
6.82g
N/A
Folate
44µg
45µg
0%
Trans fat
0.003g
N/A
Monounsaturated fat
0.391g
0.445g
0%
Tryptophan
0.04mg
0.132mg
0%
Threonine
0.083mg
0.443mg
0%
Isoleucine
0.105mg
0.552mg
0%
Leucine
0.2mg
1.07mg
0%
Lysine
0.135mg
0.409mg
0%
Methionine
0.04mg
0.258mg
0%
Phenylalanine
0.13mg
0.737mg
0%
Valine
0.151mg
0.681mg
0%
Histidine
0.057mg
0.36mg
0%
Fructose
0g
0.24g
0%
Omega-3 - ALA
0.065g
N/A
Macronutrient Comparison
Macronutrient breakdown side-by-side comparison
1
2%
12%
84%
Protein:
2.37 g
Fats:
1.36 g
Carbs:
11.67 g
Water:
84.03 g
Other:
0.57 g
4
15%
2%
70%
11%
2%
Protein:
14.57 g
Fats:
2.43 g
Carbs:
70.19 g
Water:
11.02 g
Other:
1.79 g
Contains
more
Water Water
+662.5%
Contains
more
Protein Protein
+514.8%
Contains
more
Fats Fats
+78.7%
Contains
more
Carbs Carbs
+501.5%
Contains
more
Other Other
+214%
Fat Type Comparison
Fat type breakdown side-by-side comparison
1
22%
37%
41%
Saturated fat:
Sat. Fat
0.226 g
Monounsaturated fat:
Mono. Fat
0.391 g
Polyunsaturated fat:
Poly. Fat
0.426 g
2
19%
21%
60%
Saturated fat:
Sat. Fat
0.406 g
Monounsaturated fat:
Mono. Fat
0.445 g
Polyunsaturated fat:
Poly. Fat
1.258 g
Contains
less
Sat. Fat Saturated fat
-44.3%
Contains
more
Mono. Fat Monounsaturated fat
+13.8%
Contains
more
Poly. Fat Polyunsaturated fat
+195.3%
Carbohydrate type comparison
Carbohydrate type breakdown side-by-side comparison
1
96%
3%
Starch:
10.37 g
Sucrose:
0.29 g
Glucose:
0 g
Fructose:
0 g
Lactose:
0 g
Maltose:
0 g
Galactose:
0.16 g
5
89%
8%
Starch:
53.92 g
Sucrose:
0.59 g
Glucose:
0.84 g
Fructose:
0.24 g
Lactose:
0 g
Maltose:
5.15 g
Galactose:
0 g
Contains
more
Galactose Galactose
+∞%
Contains
more
Starch Starch
+420%
Contains
more
Sucrose Sucrose
+103.4%
Contains
more
Glucose Glucose
+∞%
Contains
more
Fructose Fructose
+∞%
Contains
more
Maltose Maltose
+∞%