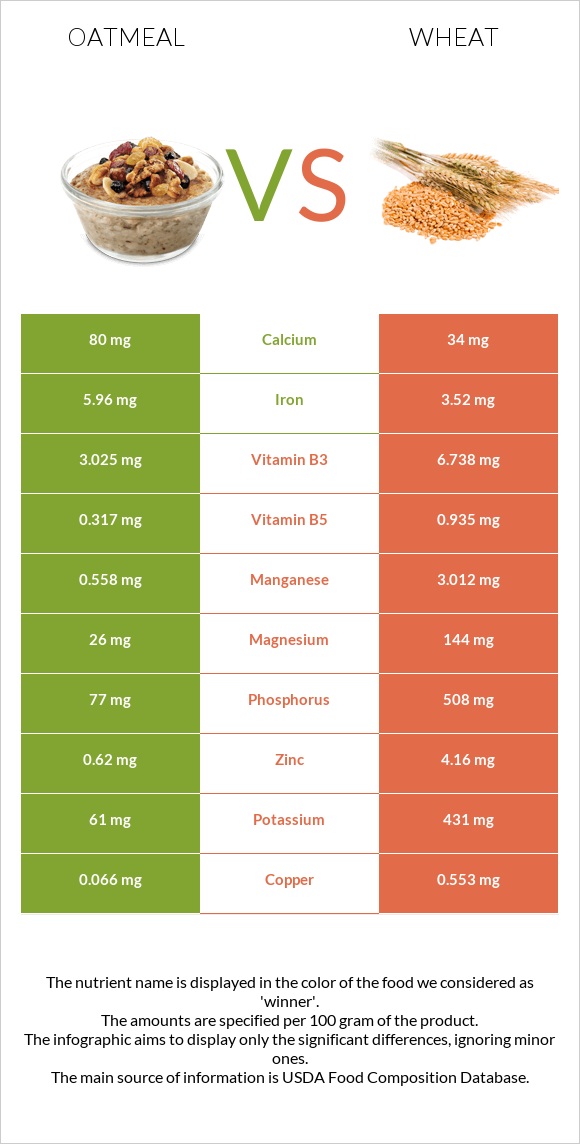
How are oatmeal and wheat different? Oatmeal is higher in iron; however, wheat is richer in selenium, manganese, phosphorus, copper, zinc, magnesium, vitamin B3, vitamin B1, and vitamin B5. Daily need coverage for selenium for wheat is 153% higher. Oatmeal contains 2 times more iron than wheat . While oatmeal contains 5.96mg of iron, wheat contains only 3.52mg. Wheat has a lower glycemic index (50) than oatmeal (79). Cereals, oats, instant, fortified, plain, prepared with water (boiling water added or microwaved) and Wheat, durum are the varieties used in this article.
Infographic
Mineral Comparison
Mineral comparison score is based on the number of minerals by which one or the other food is richer. The "coverage" charts below show how much of the daily needs can be covered by 300 grams of the food.
2
100 g
300 g
1 oz, dry, yields - 177g 1 packet, dry, yields - 177g 1 cup, cooked - 234g 1 cup, dry, yields - 501g
Magnesium
Magnesium
Calcium
Calcium
Potassium
Potassium
Iron
Iron
Copper
Copper
Zinc
Zinc
Phosphorus
Phosphorus
Sodium
Sodium
Manganese
Manganese
Selenium
Selenium
19%
24%
5.4%
224%
22%
17%
33%
6.4%
73%
27%
8
100 g
300 g
1 cup - 192g
Magnesium
Magnesium
Calcium
Calcium
Potassium
Potassium
Iron
Iron
Copper
Copper
Zinc
Zinc
Phosphorus
Phosphorus
Sodium
Sodium
Manganese
Manganese
Selenium
Selenium
103%
10%
38%
132%
184%
113%
218%
0.26%
393%
488%
Vitamin Comparison
Vitamin comparison score is based on the number of vitamins by which one or the other food is richer. The "coverage" charts below show how much of the daily needs can be covered by 300 grams of the food.
4
100 g
300 g
1 oz, dry, yields - 177g 1 packet, dry, yields - 177g 1 cup, cooked - 234g 1 cup, dry, yields - 501g
Vitamin C
Vit. C
Vitamin D
Vit. D
Vitamin A
Vit. A
Vitamin E
Vit. E
Vitamin B1
Vit. B1
Vitamin B2
Vit. B2
Vitamin B3
Vit. B3
Vitamin B5
Vit. B5
Vitamin B6
Vit. B6
Vitamin B12
Vit. B12
Vitamin K
Vit. K
Folate
Folate
0%
0%
43%
1.4%
65%
50%
57%
19%
67%
0%
1%
33%
4
100 g
300 g
1 cup - 192g
Vitamin C
Vit. C
Vitamin D
Vit. D
Vitamin A
Vit. A
Vitamin E
Vit. E
Vitamin B1
Vit. B1
Vitamin B2
Vit. B2
Vitamin B3
Vit. B3
Vitamin B5
Vit. B5
Vitamin B6
Vit. B6
Vitamin B12
Vit. B12
Vitamin K
Vit. K
Folate
Folate
0%
0%
0%
0%
105%
28%
126%
56%
97%
0%
0%
32%
All nutrients comparison - raw data values
Nutrient
DV% diff.
Selenium
5µg
89.4µg
153%
Manganese
0.558mg
3.012mg
107%
Phosphorus
77mg
508mg
62%
Copper
0.066mg
0.553mg
54%
Zinc
0.62mg
4.16mg
32%
Iron
5.96mg
3.52mg
31%
Magnesium
26mg
144mg
28%
Protein
2.37g
13.68g
23%
Vitamin B3
3.025mg
6.738mg
23%
Carbs
11.67g
71.13g
20%
Calories
68kcal
339kcal
14%
Vitamin A
130µg
0µg
14%
Vitamin B1
0.26mg
0.419mg
13%
Vitamin B5
0.317mg
0.935mg
12%
Potassium
61mg
431mg
11%
Vitamin B6
0.29mg
0.419mg
10%
Fiber
1.7g
7%
Vitamin B2
0.215mg
0.121mg
7%
Calcium
80mg
34mg
5%
Starch
10.37g
4%
Polyunsaturated fat
0.426g
0.978g
4%
Fats
1.36g
2.47g
2%
Sodium
49mg
2mg
2%
Choline
4.7mg
1%
Saturated fat
0.226g
0.454g
1%
Protein per 100 calories
3.5g
4g
N/A
Calories per 10 g protein
287kcal
248kcal
N/A
Weight per 100 calories
147g
29g
N/A
Unsaturated / Saturated Fat ratio
3.6
2.9
N/A
Net carbs
9.97g
71.13g
N/A
Sugar
0.46g
N/A
Vitamin E
0.07mg
0%
Vitamin K
0.4µg
0%
Folate
44µg
43µg
0%
Trans fat
0.003g
N/A
Monounsaturated fat
0.391g
0.344g
0%
Tryptophan
0.04mg
0.176mg
0%
Threonine
0.083mg
0.366mg
0%
Isoleucine
0.105mg
0.533mg
0%
Leucine
0.2mg
0.934mg
0%
Lysine
0.135mg
0.303mg
0%
Methionine
0.04mg
0.221mg
0%
Phenylalanine
0.13mg
0.681mg
0%
Valine
0.151mg
0.594mg
0%
Histidine
0.057mg
0.322mg
0%
Macronutrient Comparison
Macronutrient breakdown side-by-side comparison
1
2%
12%
84%
Protein:
2.37 g
Fats:
1.36 g
Carbs:
11.67 g
Water:
84.03 g
Other:
0.57 g
4
14%
2%
71%
11%
2%
Protein:
13.68 g
Fats:
2.47 g
Carbs:
71.13 g
Water:
10.94 g
Other:
1.78 g
Contains
more
Water Water
+668.1%
Contains
more
Protein Protein
+477.2%
Contains
more
Fats Fats
+81.6%
Contains
more
Carbs Carbs
+509.5%
Contains
more
Other Other
+212.3%
Fat Type Comparison
Fat type breakdown side-by-side comparison
2
22%
37%
41%
Saturated fat:
Sat. Fat
0.226 g
Monounsaturated fat:
Mono. Fat
0.391 g
Polyunsaturated fat:
Poly. Fat
0.426 g
1
26%
19%
55%
Saturated fat:
Sat. Fat
0.454 g
Monounsaturated fat:
Mono. Fat
0.344 g
Polyunsaturated fat:
Poly. Fat
0.978 g
Contains
less
Sat. Fat Saturated fat
-50.2%
Contains
more
Mono. Fat Monounsaturated fat
+13.7%
Contains
more
Poly. Fat Polyunsaturated fat
+129.6%