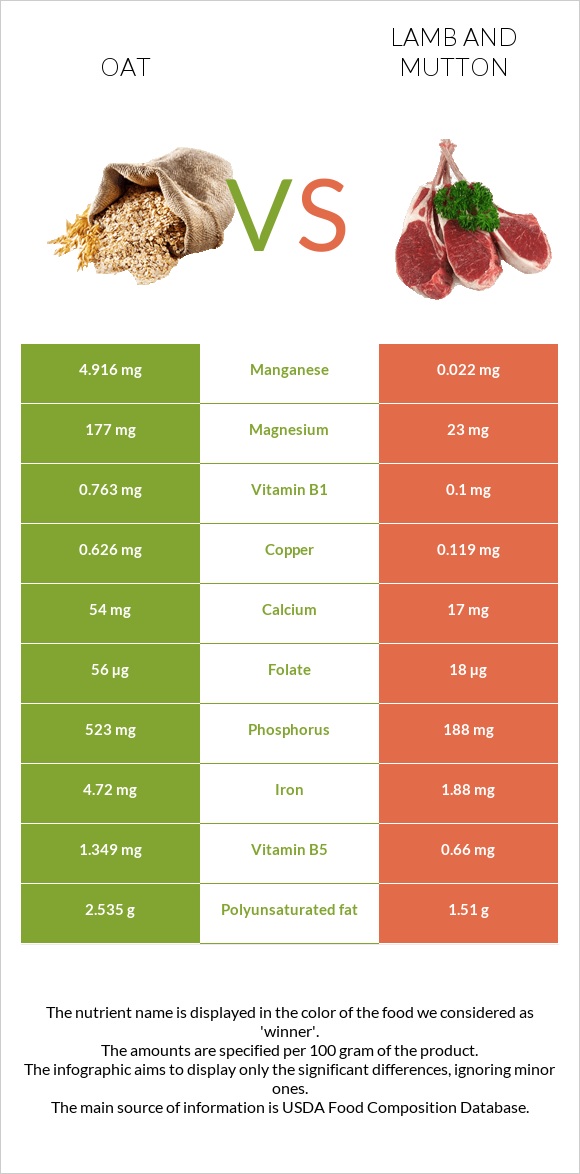
Significant differences between oats and lamb Oats have more manganese, copper, vitamin B1, phosphorus, fiber, magnesium, and iron; however, lamb is richer in vitamin B12 and vitamin B3. Oats cover your daily manganese needs 213% more than lamb. Oats contain less saturated fat. Oats have a higher glycemic index. The glycemic index of oats is 59, while the glycemic index of lamb is 0. Specific food types used in this comparison are Oats and Lamb, domestic, composite of trimmed retail cuts, separable lean, and fat, trimmed to 1/4" fat, choice, cooked .
Infographic
Mineral Comparison
Mineral comparison score is based on the number of minerals by which one or the other food is richer. The "coverage" charts below show how much of the daily needs can be covered by 300 grams of the food.
8
100 g
300 g
1 cup - 156g
Magnesium
Magnesium
Calcium
Calcium
Potassium
Potassium
Iron
Iron
Copper
Copper
Zinc
Zinc
Phosphorus
Phosphorus
Sodium
Sodium
Manganese
Manganese
Selenium
Selenium
126%
16%
38%
177%
209%
108%
224%
0.26%
641%
0%
2
100 g
300 g
3 oz - 85g 1 piece, cooked, excluding refuse (yield from 1 lb raw meat with refuse) - 242g
Magnesium
Magnesium
Calcium
Calcium
Potassium
Potassium
Iron
Iron
Copper
Copper
Zinc
Zinc
Phosphorus
Phosphorus
Sodium
Sodium
Manganese
Manganese
Selenium
Selenium
16%
5.1%
27%
71%
40%
122%
81%
9.4%
2.9%
144%
Vitamin Comparison
Vitamin comparison score is based on the number of vitamins by which one or the other food is richer. The "coverage" charts below show how much of the daily needs can be covered by 300 grams of the food.
3
100 g
300 g
1 cup - 156g
Vitamin C
Vit. C
Vitamin D
Vit. D
Vitamin A
Vit. A
Vitamin E
Vit. E
Vitamin B1
Vit. B1
Vitamin B2
Vit. B2
Vitamin B3
Vit. B3
Vitamin B5
Vit. B5
Vitamin B6
Vit. B6
Vitamin B12
Vit. B12
Vitamin K
Vit. K
Folate
Folate
0%
0%
0%
0%
191%
32%
18%
81%
27%
0%
0%
42%
6
100 g
300 g
3 oz - 85g 1 piece, cooked, excluding refuse (yield from 1 lb raw meat with refuse) - 242g
Vitamin C
Vit. C
Vitamin D
Vit. D
Vitamin A
Vit. A
Vitamin E
Vit. E
Vitamin B1
Vit. B1
Vitamin B2
Vit. B2
Vitamin B3
Vit. B3
Vitamin B5
Vit. B5
Vitamin B6
Vit. B6
Vitamin B12
Vit. B12
Vitamin K
Vit. K
Folate
Folate
0%
1.5%
0%
2.8%
25%
58%
125%
40%
30%
319%
12%
14%
All nutrients comparison - raw data values
Nutrient
DV% diff.
Manganese
4.916mg
0.022mg
213%
Vitamin B12
0µg
2.55µg
106%
Copper
0.626mg
0.119mg
56%
Vitamin B1
0.763mg
0.1mg
55%
Phosphorus
523mg
188mg
48%
Selenium
26.4µg
48%
Fiber
10.6g
0g
42%
Magnesium
177mg
23mg
37%
Iron
4.72mg
1.88mg
36%
Vitamin B3
0.961mg
6.66mg
36%
Saturated fat
1.217g
8.83g
35%
Cholesterol
0mg
97mg
32%
Fats
6.9g
20.94g
22%
Carbs
66.27g
0g
22%
Choline
93.7mg
17%
Monounsaturated fat
2.178g
8.82g
17%
Protein
16.89g
24.52g
15%
Vitamin B5
1.349mg
0.66mg
14%
Folate
56µg
18µg
10%
Vitamin B2
0.139mg
0.25mg
9%
Polyunsaturated fat
2.535g
1.51g
7%
Calories
389kcal
294kcal
5%
Calcium
54mg
17mg
4%
Potassium
429mg
310mg
4%
Zinc
3.97mg
4.46mg
4%
Vitamin K
4.6µg
4%
Sodium
2mg
72mg
3%
Vitamin D
0µg
0.1µg
1%
Vitamin E
0.14mg
1%
Vitamin B6
0.119mg
0.13mg
1%
Protein per 100 calories
4.3g
8.3g
N/A
Calories per 10 g protein
230kcal
120kcal
N/A
Weight per 100 calories
26g
34g
N/A
Unsaturated / Saturated Fat ratio
3.9
1.2
N/A
Net carbs
55.67g
0g
N/A
Vitamin D*
0 IU
2 IU
0%
Tryptophan
0.234mg
0.287mg
0%
Threonine
0.575mg
1.05mg
0%
Isoleucine
0.694mg
1.183mg
0%
Leucine
1.284mg
1.908mg
0%
Lysine
0.701mg
2.166mg
0%
Methionine
0.312mg
0.629mg
0%
Phenylalanine
0.895mg
0.998mg
0%
Valine
0.937mg
1.323mg
0%
Histidine
0.405mg
0.777mg
0%
Macronutrient Comparison
Macronutrient breakdown side-by-side comparison
2
17%
7%
66%
8%
2%
Protein:
16.89 g
Fats:
6.9 g
Carbs:
66.27 g
Water:
8.22 g
Other:
1.72 g
3
25%
21%
54%
Protein:
24.52 g
Fats:
20.94 g
Carbs:
0 g
Water:
53.72 g
Other:
0.82 g
Contains
more
Carbs Carbs
+∞%
Contains
more
Other Other
+109.8%
Contains
more
Protein Protein
+45.2%
Contains
more
Fats Fats
+203.5%
Contains
more
Water Water
+553.5%
Fat Type Comparison
Fat type breakdown side-by-side comparison
2
21%
37%
43%
Saturated fat:
Sat. Fat
1.217 g
Monounsaturated fat:
Mono. Fat
2.178 g
Polyunsaturated fat:
Poly. Fat
2.535 g
1
46%
46%
8%
Saturated fat:
Sat. Fat
8.83 g
Monounsaturated fat:
Mono. Fat
8.82 g
Polyunsaturated fat:
Poly. Fat
1.51 g
Contains
less
Sat. Fat Saturated fat
-86.2%
Contains
more
Poly. Fat Polyunsaturated fat
+67.9%
Contains
more
Mono. Fat Monounsaturated fat
+305%