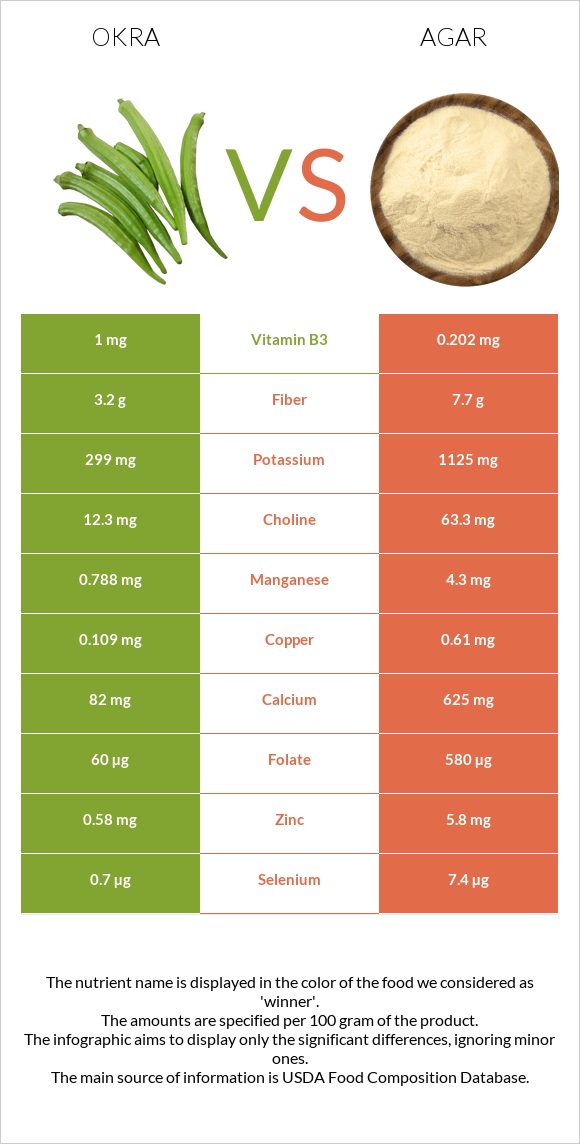
Differences between okra and agar Okra has more vitamin C, while agar has more iron, magnesium, manganese, folate, copper, vitamin B5, calcium, zinc, and vitamin E. Agar's daily need coverage for iron is 260% higher. The food types used in this comparison are Okra, raw and Seaweed, agar, dried .
Infographic
Mineral Comparison
Mineral comparison score is based on the number of minerals by which one or the other food is richer. The "coverage" charts below show how much of the daily needs can be covered by 300 grams of the food.
2
100 g
300 g
8 pods (3" long) - 95g
Magnesium
Magnesium
Calcium
Calcium
Potassium
Potassium
Iron
Iron
Copper
Copper
Zinc
Zinc
Phosphorus
Phosphorus
Sodium
Sodium
Manganese
Manganese
Selenium
Selenium
41%
25%
26%
23%
36%
16%
26%
0.91%
103%
3.8%
8
100 g
300 g
Magnesium
Magnesium
Calcium
Calcium
Potassium
Potassium
Iron
Iron
Copper
Copper
Zinc
Zinc
Phosphorus
Phosphorus
Sodium
Sodium
Manganese
Manganese
Selenium
Selenium
550%
188%
99%
803%
203%
158%
22%
13%
561%
40%
Vitamin Comparison
Vitamin comparison score is based on the number of vitamins by which one or the other food is richer. The "coverage" charts below show how much of the daily needs can be covered by 300 grams of the food.
5
100 g
300 g
8 pods (3" long) - 95g
Vitamin C
Vit. C
Vitamin D
Vit. D
Vitamin A
Vit. A
Vitamin E
Vit. E
Vitamin B1
Vit. B1
Vitamin B2
Vit. B2
Vitamin B3
Vit. B3
Vitamin B5
Vit. B5
Vitamin B6
Vit. B6
Vitamin B12
Vit. B12
Vitamin K
Vit. K
Folate
Folate
77%
0%
12%
5.4%
50%
14%
19%
15%
50%
0%
78%
45%
5
100 g
300 g
Vitamin C
Vit. C
Vitamin D
Vit. D
Vitamin A
Vit. A
Vitamin E
Vit. E
Vitamin B1
Vit. B1
Vitamin B2
Vit. B2
Vitamin B3
Vit. B3
Vitamin B5
Vit. B5
Vitamin B6
Vit. B6
Vitamin B12
Vit. B12
Vitamin K
Vit. K
Folate
Folate
0%
0%
0%
100%
2.5%
51%
3.8%
181%
70%
0%
61%
435%
All nutrients comparison - raw data values
Nutrient
DV% diff.
Iron
0.62mg
21.4mg
260%
Magnesium
57mg
770mg
170%
Manganese
0.788mg
4.3mg
153%
Folate
60µg
580µg
130%
Copper
0.109mg
0.61mg
56%
Vitamin B5
0.245mg
3.018mg
55%
Calcium
82mg
625mg
54%
Zinc
0.58mg
5.8mg
47%
Vitamin E
0.27mg
5mg
32%
Vitamin C
23mg
0mg
26%
Carbs
7.45g
80.88g
24%
Potassium
299mg
1125mg
24%
Fiber
3.2g
7.7g
18%
Vitamin B1
0.2mg
0.01mg
16%
Calories
33kcal
306kcal
14%
Selenium
0.7µg
7.4µg
12%
Vitamin B2
0.06mg
0.222mg
12%
Protein
1.93g
6.21g
9%
Choline
12.3mg
63.3mg
9%
Vitamin B6
0.215mg
0.303mg
7%
Vitamin K
31.3µg
24.4µg
6%
Vitamin B3
1mg
0.202mg
5%
Sodium
7mg
102mg
4%
Vitamin A
36µg
0µg
4%
Phosphorus
61mg
52mg
1%
Polyunsaturated fat
0.027g
0.102g
1%
Fructose
0.57g
1%
Protein per 100 calories
5.8g
2g
N/A
Calories per 10 g protein
171kcal
493kcal
N/A
Weight per 100 calories
303g
33g
N/A
Fats
0.19g
0.3g
0%
Net carbs
4.25g
73.18g
N/A
Sugar
1.48g
2.97g
N/A
Starch
0.34g
0%
Saturated fat
0.026g
0.061g
0%
Monounsaturated fat
0.017g
0.027g
0%
Tryptophan
0.017mg
0%
Threonine
0.065mg
0%
Isoleucine
0.069mg
0%
Leucine
0.105mg
0%
Lysine
0.081mg
0%
Methionine
0.021mg
0%
Phenylalanine
0.065mg
0%
Valine
0.091mg
0%
Histidine
0.031mg
0%
Omega-3 - EPA
0g
0.087g
N/A
Macronutrient Comparison
Macronutrient breakdown side-by-side comparison
1
2%
7%
90%
Protein:
1.93 g
Fats:
0.19 g
Carbs:
7.45 g
Water:
89.58 g
Other:
0.85 g
4
6%
81%
9%
4%
Protein:
6.21 g
Fats:
0.3 g
Carbs:
80.88 g
Water:
8.68 g
Other:
3.93 g
Contains
more
Water Water
+932%
Contains
more
Protein Protein
+221.8%
Contains
more
Fats Fats
+57.9%
Contains
more
Carbs Carbs
+985.6%
Contains
more
Other Other
+362.4%
Fat Type Comparison
Fat type breakdown side-by-side comparison
1
37%
24%
39%
Saturated fat:
Sat. Fat
0.026 g
Monounsaturated fat:
Mono. Fat
0.017 g
Polyunsaturated fat:
Poly. Fat
0.027 g
2
32%
14%
54%
Saturated fat:
Sat. Fat
0.061 g
Monounsaturated fat:
Mono. Fat
0.027 g
Polyunsaturated fat:
Poly. Fat
0.102 g
Contains
less
Sat. Fat Saturated fat
-57.4%
Contains
more
Mono. Fat Monounsaturated fat
+58.8%
Contains
more
Poly. Fat Polyunsaturated fat
+277.8%