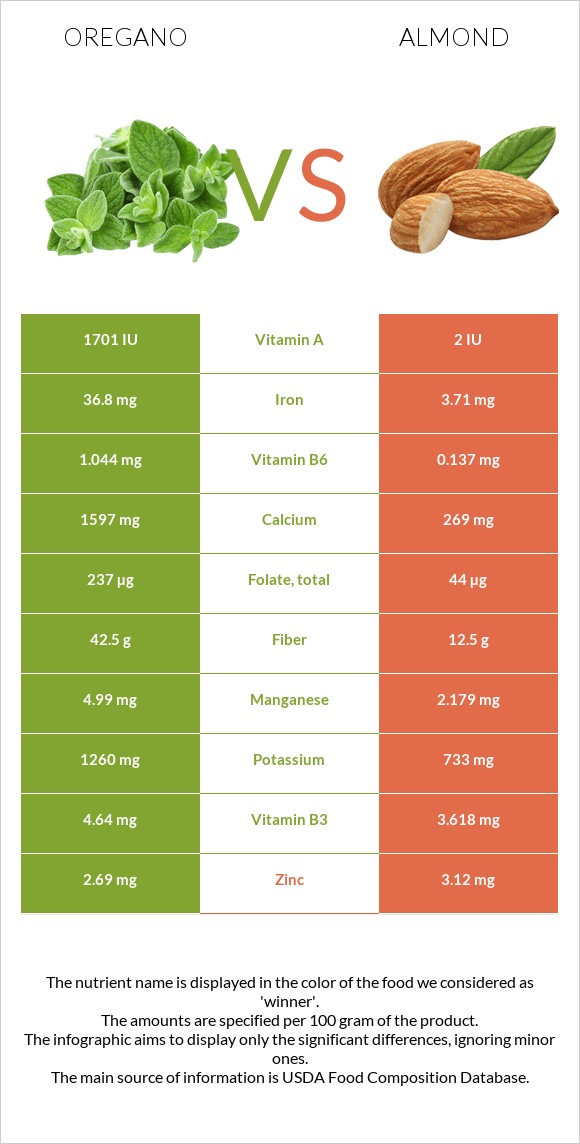
How are oregano and almonds different? Oregano is richer in vitamin K, iron, calcium, manganese, fiber, vitamin B6, and folate, while almonds are higher in vitamin E, phosphorus, and vitamin B2. Oregano covers your daily need for vitamin K, 518% more than almonds. Oregano contains 10 times more iron than almonds. Oregano contains 36.8mg of iron, while almonds contain 3.71mg. Spices, oregano, dried and Nuts, almonds types were used in this article.
Infographic
Mineral Comparison
Mineral comparison score is based on the number of minerals by which one or the other food is richer. The "coverage" charts below show how much of the daily needs can be covered by 300 grams of the food.
4
100 g
300 g
0.25 tsp - 0.5g 1 tsp, ground - 1.8g
Magnesium
Magnesium
Calcium
Calcium
Potassium
Potassium
Iron
Iron
Copper
Copper
Zinc
Zinc
Phosphorus
Phosphorus
Sodium
Sodium
Manganese
Manganese
Selenium
Selenium
193%
479%
111%
1380%
211%
73%
63%
3.3%
651%
25%
4
100 g
300 g
1 almond - 1.2g 1 oz (23 whole kernels) - 28.35g 1 cup, sliced - 92g 1 cup, ground - 95g 1 cup, slivered - 108g 1 cup, whole - 143g
Magnesium
Magnesium
Calcium
Calcium
Potassium
Potassium
Iron
Iron
Copper
Copper
Zinc
Zinc
Phosphorus
Phosphorus
Sodium
Sodium
Manganese
Manganese
Selenium
Selenium
193%
81%
65%
139%
344%
85%
206%
0.13%
284%
22%
Vitamin Comparison
Vitamin comparison score is based on the number of vitamins by which one or the other food is richer. The "coverage" charts below show how much of the daily needs can be covered by 300 grams of the food.
7
100 g
300 g
0.25 tsp - 0.5g 1 tsp, ground - 1.8g
Vitamin C
Vit. C
Vitamin D
Vit. D
Vitamin A
Vit. A
Vitamin E
Vit. E
Vitamin B1
Vit. B1
Vitamin B2
Vit. B2
Vitamin B3
Vit. B3
Vitamin B5
Vit. B5
Vitamin B6
Vit. B6
Vitamin B12
Vit. B12
Vitamin K
Vit. K
Folate
Folate
7.7%
0%
28%
365%
44%
122%
87%
55%
241%
0%
1554%
178%
3
100 g
300 g
1 almond - 1.2g 1 oz (23 whole kernels) - 28.35g 1 cup, sliced - 92g 1 cup, ground - 95g 1 cup, slivered - 108g 1 cup, whole - 143g
Vitamin C
Vit. C
Vitamin D
Vit. D
Vitamin A
Vit. A
Vitamin E
Vit. E
Vitamin B1
Vit. B1
Vitamin B2
Vit. B2
Vitamin B3
Vit. B3
Vitamin B5
Vit. B5
Vitamin B6
Vit. B6
Vitamin B12
Vit. B12
Vitamin K
Vit. K
Folate
Folate
0%
0%
0%
513%
51%
263%
68%
28%
32%
0%
0%
33%
All nutrients comparison - raw data values
Nutrient
DV% diff.
Vitamin K
621.7µg
0µg
518%
Iron
36.8mg
3.71mg
414%
Calcium
1597mg
269mg
133%
Manganese
4.99mg
2.179mg
122%
Fiber
42.5g
12.5g
120%
Monounsaturated fat
0.716g
31.551g
77%
Polyunsaturated fat
1.369g
12.329g
73%
Fats
4.28g
49.93g
70%
Vitamin B6
1.044mg
0.137mg
70%
Vitamin E
18.26mg
25.63mg
49%
Phosphorus
148mg
481mg
48%
Folate
237µg
44µg
48%
Vitamin B2
0.528mg
1.138mg
47%
Copper
0.633mg
1.031mg
44%
Protein
9g
21.15g
24%
Calories
265kcal
579kcal
16%
Carbs
68.92g
21.55g
16%
Potassium
1260mg
733mg
16%
Saturated fat
1.551g
3.802g
10%
Vitamin A
85µg
0µg
9%
Vitamin B5
0.921mg
0.471mg
9%
Vitamin B3
4.64mg
3.618mg
6%
Zinc
2.69mg
3.12mg
4%
Choline
32.3mg
52.1mg
4%
Vitamin C
2.3mg
0mg
3%
Vitamin B1
0.177mg
0.205mg
2%
Sodium
25mg
1mg
1%
Selenium
4.5µg
4.1µg
1%
Fructose
1.13g
0.11g
1%
Protein per 100 calories
3.4g
3.7g
N/A
Calories per 10 g protein
294kcal
274kcal
N/A
Weight per 100 calories
38g
17g
N/A
Unsaturated / Saturated Fat ratio
1.3
12
N/A
Net carbs
26.42g
9.05g
N/A
Magnesium
270mg
270mg
0%
Sugar
4.09g
4.35g
N/A
Starch
0.72g
0%
Trans fat
0g
0.015g
N/A
Tryptophan
0.203mg
0.211mg
0%
Threonine
0.322mg
0.601mg
0%
Isoleucine
0.441mg
0.751mg
0%
Leucine
0.78mg
1.473mg
0%
Lysine
0.5mg
0.568mg
0%
Methionine
0.127mg
0.157mg
0%
Phenylalanine
0.449mg
1.132mg
0%
Valine
0.585mg
0.855mg
0%
Histidine
0.144mg
0.539mg
0%
Omega-3 - ALA
0.621g
0.003g
N/A
Omega-6 - Eicosadienoic acid
0g
0.002g
N/A
Omega-6 - Linoleic acid
12.32g
N/A
Macronutrient Comparison
Macronutrient breakdown side-by-side comparison
3
9%
4%
69%
10%
8%
Protein:
9 g
Fats:
4.28 g
Carbs:
68.92 g
Water:
9.93 g
Other:
7.87 g
2
21%
50%
22%
4%
3%
Protein:
21.15 g
Fats:
49.93 g
Carbs:
21.55 g
Water:
4.41 g
Other:
2.96 g
Contains
more
Carbs Carbs
+219.8%
Contains
more
Water Water
+125.2%
Contains
more
Other Other
+165.9%
Contains
more
Protein Protein
+135%
Contains
more
Fats Fats
+1066.6%
Fat Type Comparison
Fat type breakdown side-by-side comparison
1
43%
20%
38%
Saturated fat:
Sat. Fat
1.551 g
Monounsaturated fat:
Mono. Fat
0.716 g
Polyunsaturated fat:
Poly. Fat
1.369 g
2
8%
66%
26%
Saturated fat:
Sat. Fat
3.802 g
Monounsaturated fat:
Mono. Fat
31.551 g
Polyunsaturated fat:
Poly. Fat
12.329 g
Contains
less
Sat. Fat Saturated fat
-59.2%
Contains
more
Mono. Fat Monounsaturated fat
+4306.6%
Contains
more
Poly. Fat Polyunsaturated fat
+800.6%
Carbohydrate type comparison
Carbohydrate type breakdown side-by-side comparison
3
22%
46%
28%
4%
Starch:
0 g
Sucrose:
0.91 g
Glucose:
1.9 g
Fructose:
1.13 g
Lactose:
0 g
Maltose:
0 g
Galactose:
0.15 g
3
14%
78%
3%
2%
Starch:
0.72 g
Sucrose:
3.95 g
Glucose:
0.17 g
Fructose:
0.11 g
Lactose:
0 g
Maltose:
0.04 g
Galactose:
0.07 g
Contains
more
Glucose Glucose
+1017.6%
Contains
more
Fructose Fructose
+927.3%
Contains
more
Galactose Galactose
+114.3%
Contains
more
Starch Starch
+∞%
Contains
more
Sucrose Sucrose
+334.1%
Contains
more
Maltose Maltose
+∞%