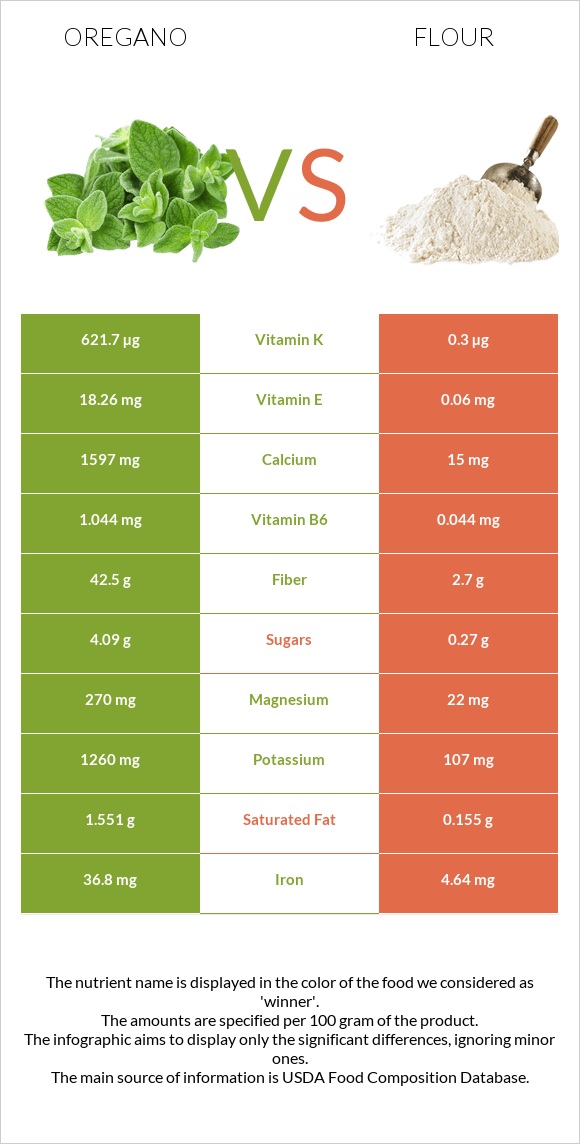
How are oregano and flour different? Oregano is richer in vitamin K, iron, manganese, fiber, calcium, vitamin E, vitamin B6, magnesium, and copper, while flour is higher in selenium. Oregano covers your daily need for vitamin K, 518% more than flour. Oregano contains 304 times more vitamin E than flour. Oregano contains 18.26mg of vitamin E, while flour contains 0.06mg. Flour has a higher glycemic index (72) than oregano (5). Spices, oregano, dried and Wheat flour, white, all-purpose, enriched, bleached types were used in this article.
Infographic
Mineral Comparison
Mineral comparison score is based on the number of minerals by which one or the other food is richer. The "coverage" charts below show how much of the daily needs can be covered by 300 grams of the food.
8
100 g
300 g
0.25 tsp - 0.5g 1 tsp, ground - 1.8g
Magnesium
Magnesium
Calcium
Calcium
Potassium
Potassium
Iron
Iron
Copper
Copper
Zinc
Zinc
Phosphorus
Phosphorus
Sodium
Sodium
Manganese
Manganese
Selenium
Selenium
193%
479%
111%
1380%
211%
73%
63%
3.3%
651%
25%
2
100 g
300 g
1 cup - 125g
Magnesium
Magnesium
Calcium
Calcium
Potassium
Potassium
Iron
Iron
Copper
Copper
Zinc
Zinc
Phosphorus
Phosphorus
Sodium
Sodium
Manganese
Manganese
Selenium
Selenium
16%
4.5%
9.4%
174%
48%
19%
46%
0.26%
89%
185%
Vitamin Comparison
Vitamin comparison score is based on the number of vitamins by which one or the other food is richer. The "coverage" charts below show how much of the daily needs can be covered by 300 grams of the food.
7
100 g
300 g
0.25 tsp - 0.5g 1 tsp, ground - 1.8g
Vitamin C
Vit. C
Vitamin D
Vit. D
Vitamin A
Vit. A
Vitamin E
Vit. E
Vitamin B1
Vit. B1
Vitamin B2
Vit. B2
Vitamin B3
Vit. B3
Vitamin B5
Vit. B5
Vitamin B6
Vit. B6
Vitamin B12
Vit. B12
Vitamin K
Vit. K
Folate
Folate
7.7%
0%
28%
365%
44%
122%
87%
55%
241%
0%
1554%
178%
2
100 g
300 g
1 cup - 125g
Vitamin C
Vit. C
Vitamin D
Vit. D
Vitamin A
Vit. A
Vitamin E
Vit. E
Vitamin B1
Vit. B1
Vitamin B2
Vit. B2
Vitamin B3
Vit. B3
Vitamin B5
Vit. B5
Vitamin B6
Vit. B6
Vitamin B12
Vit. B12
Vitamin K
Vit. K
Folate
Folate
0%
0%
0%
1.2%
196%
114%
111%
26%
10%
0%
0.75%
137%
All nutrients comparison - raw data values
Nutrient
DV% diff.
Vitamin K
621.7µg
0.3µg
518%
Iron
36.8mg
4.64mg
402%
Manganese
4.99mg
0.682mg
187%
Fiber
42.5g
2.7g
159%
Calcium
1597mg
15mg
158%
Vitamin E
18.26mg
0.06mg
121%
Vitamin B6
1.044mg
0.044mg
77%
Magnesium
270mg
22mg
59%
Copper
0.633mg
0.144mg
54%
Selenium
4.5µg
33.9µg
53%
Vitamin B1
0.177mg
0.785mg
51%
Potassium
1260mg
107mg
34%
Zinc
2.69mg
0.7mg
18%
Folate
237µg
183µg
14%
Vitamin B5
0.921mg
0.438mg
10%
Vitamin A
85µg
0µg
9%
Vitamin B3
4.64mg
5.904mg
8%
Phosphorus
148mg
108mg
6%
Saturated fat
1.551g
0.155g
6%
Polyunsaturated fat
1.369g
0.413g
6%
Calories
265kcal
364kcal
5%
Fats
4.28g
0.98g
5%
Choline
32.3mg
10.4mg
4%
Protein
9g
10.33g
3%
Vitamin C
2.3mg
0mg
3%
Vitamin B2
0.528mg
0.494mg
3%
Carbs
68.92g
76.31g
2%
Monounsaturated fat
0.716g
0.087g
2%
Sodium
25mg
2mg
1%
Fructose
1.13g
1%
Protein per 100 calories
3.4g
2.8g
N/A
Calories per 10 g protein
294kcal
352kcal
N/A
Weight per 100 calories
38g
27g
N/A
Unsaturated / Saturated Fat ratio
1.3
3.2
N/A
Net carbs
26.42g
73.61g
N/A
Sugar
4.09g
0.27g
N/A
Tryptophan
0.203mg
0.127mg
0%
Threonine
0.322mg
0.281mg
0%
Isoleucine
0.441mg
0.357mg
0%
Leucine
0.78mg
0.71mg
0%
Lysine
0.5mg
0.228mg
0%
Methionine
0.127mg
0.183mg
0%
Phenylalanine
0.449mg
0.52mg
0%
Valine
0.585mg
0.415mg
0%
Histidine
0.144mg
0.23mg
0%
Omega-3 - ALA
0.621g
N/A
Macronutrient Comparison
Macronutrient breakdown side-by-side comparison
2
9%
4%
69%
10%
8%
Protein:
9 g
Fats:
4.28 g
Carbs:
68.92 g
Water:
9.93 g
Other:
7.87 g
3
10%
76%
12%
Protein:
10.33 g
Fats:
0.98 g
Carbs:
76.31 g
Water:
11.92 g
Other:
0.46 g
Contains
more
Fats Fats
+336.7%
Contains
more
Other Other
+1610.9%
Contains
more
Protein Protein
+14.8%
Contains
more
Carbs Carbs
+10.7%
Contains
more
Water Water
+20%
Fat Type Comparison
Fat type breakdown side-by-side comparison
2
43%
20%
38%
Saturated fat:
Sat. Fat
1.551 g
Monounsaturated fat:
Mono. Fat
0.716 g
Polyunsaturated fat:
Poly. Fat
1.369 g
1
24%
13%
63%
Saturated fat:
Sat. Fat
0.155 g
Monounsaturated fat:
Mono. Fat
0.087 g
Polyunsaturated fat:
Poly. Fat
0.413 g
Contains
more
Mono. Fat Monounsaturated fat
+723%
Contains
more
Poly. Fat Polyunsaturated fat
+231.5%
Contains
less
Sat. Fat Saturated fat
-90%