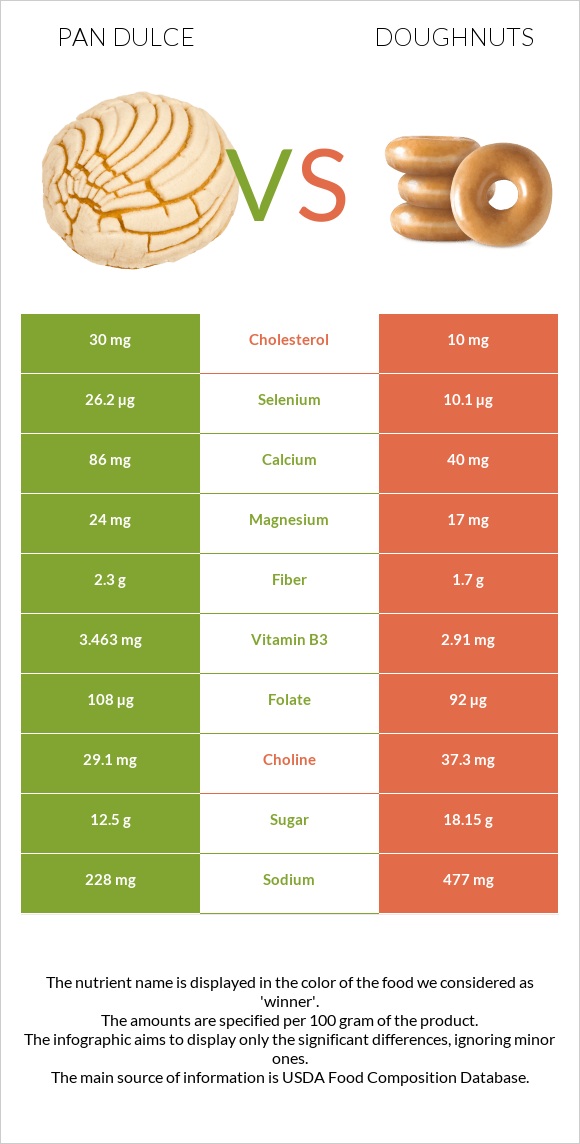
Summary of differences between pan dulce and doughnuts Pan dulce has more selenium and manganese; however, doughnuts are higher in phosphorus, vitamin E, vitamin K, and vitamin B2. Doughnuts cover your daily need for saturated fat, 45% more than pan dulce. Pan dulce has 3 times more cholesterol than doughnuts. While pan dulce has 30mg of cholesterol, doughnuts have only 10mg. The glycemic index of doughnuts is higher. These are the specific foods used in this comparison Bread, pan dulce, sweet yeast bread and Doughnuts, cake-type, plain (includes unsugared, old-fashioned) .
Infographic
Mineral Comparison
Mineral comparison score is based on the number of minerals by which one or the other food is richer. The "coverage" charts below show how much of the daily needs can be covered by 300 grams of the food.
8
100 g
300 g
1 slice (average weight of 1 slice) - 63g
Magnesium
Magnesium
Calcium
Calcium
Potassium
Potassium
Iron
Iron
Copper
Copper
Zinc
Zinc
Phosphorus
Phosphorus
Sodium
Sodium
Manganese
Manganese
Selenium
Selenium
17%
26%
9.1%
108%
40%
23%
40%
30%
60%
143%
2
100 g
300 g
1 doughnut, mini (1-1/2" dia) or doughnut hole - 14g 1 oz - 28.35g 1 donut - 40g 1 doughnut stick - 52g 1 doughnut, long type (twist) (4-1/2" long) - 52g 1 doughnut medium (3-1/4" dia) - 54g 1 doughnut, large (4" dia) - 71g
Magnesium
Magnesium
Calcium
Calcium
Potassium
Potassium
Iron
Iron
Copper
Copper
Zinc
Zinc
Phosphorus
Phosphorus
Sodium
Sodium
Manganese
Manganese
Selenium
Selenium
12%
12%
12%
95%
30%
14%
111%
62%
43%
55%
Vitamin Comparison
Vitamin comparison score is based on the number of vitamins by which one or the other food is richer. The "coverage" charts below show how much of the daily needs can be covered by 300 grams of the food.
7
100 g
300 g
1 slice (average weight of 1 slice) - 63g
Vitamin C
Vit. C
Vitamin D
Vit. D
Vitamin A
Vit. A
Vitamin E
Vit. E
Vitamin B1
Vit. B1
Vitamin B2
Vit. B2
Vitamin B3
Vit. B3
Vitamin B5
Vit. B5
Vitamin B6
Vit. B6
Vitamin B12
Vit. B12
Vitamin K
Vit. K
Folate
Folate
4%
0%
1.7%
5.8%
94%
53%
65%
35%
13%
14%
4%
81%
3
100 g
300 g
1 doughnut, mini (1-1/2" dia) or doughnut hole - 14g 1 oz - 28.35g 1 donut - 40g 1 doughnut stick - 52g 1 doughnut, long type (twist) (4-1/2" long) - 52g 1 doughnut medium (3-1/4" dia) - 54g 1 doughnut, large (4" dia) - 71g
Vitamin C
Vit. C
Vitamin D
Vit. D
Vitamin A
Vit. A
Vitamin E
Vit. E
Vitamin B1
Vit. B1
Vitamin B2
Vit. B2
Vitamin B3
Vit. B3
Vitamin B5
Vit. B5
Vitamin B6
Vit. B6
Vitamin B12
Vit. B12
Vitamin K
Vit. K
Folate
Folate
0%
0%
1.3%
40%
98%
69%
55%
23%
12%
7.5%
25%
69%
All nutrients comparison - raw data values
Nutrient
DV% diff.
Saturated fat
2.183g
11.105g
41%
Selenium
26.2µg
10.1µg
29%
Phosphorus
94mg
260mg
24%
Fats
11.58g
24.93g
21%
Polyunsaturated fat
1.53g
3.915g
16%
Monounsaturated fat
3.499g
8.544g
13%
Sodium
228mg
477mg
11%
Vitamin E
0.29mg
1.99mg
11%
Protein
9.42g
5.31g
8%
Cholesterol
30mg
10mg
7%
Vitamin K
1.6µg
9.8µg
7%
Manganese
0.46mg
0.333mg
6%
Calcium
86mg
40mg
5%
Starch
37.8g
25.91g
5%
Vitamin B2
0.23mg
0.301mg
5%
Fructose
4.05g
0g
5%
Iron
2.87mg
2.53mg
4%
Vitamin B5
0.59mg
0.377mg
4%
Folate
108µg
92µg
4%
Calories
367kcal
434kcal
3%
Carbs
56.38g
47.06g
3%
Copper
0.121mg
0.09mg
3%
Zinc
0.84mg
0.5mg
3%
Vitamin B3
3.463mg
2.91mg
3%
Magnesium
24mg
17mg
2%
Fiber
2.3g
1.7g
2%
Vitamin B12
0.11µg
0.06µg
2%
Vitamin C
1.2mg
0mg
1%
Potassium
103mg
134mg
1%
Vitamin B1
0.377mg
0.39mg
1%
Vitamin B6
0.057mg
0.05mg
1%
Choline
29.1mg
37.3mg
1%
Protein per 100 calories
2.6g
1.2g
N/A
Calories per 10 g protein
390kcal
817kcal
N/A
Weight per 100 calories
27g
23g
N/A
Unsaturated / Saturated Fat ratio
2.3
1.1
N/A
Net carbs
54.08g
45.36g
N/A
Sugar
12.5g
18.15g
N/A
Vitamin A
5µg
4µg
0%
Trans fat
1.103g
N/A
Omega-3 - DHA
0g
0.001g
N/A
Omega-3 - ALA
0.066g
0.239g
N/A
Omega-3 - DPA
0.001g
0g
N/A
Omega-3 - Eicosatrienoic acid
0.002g
0.001g
N/A
Omega-6 - Gamma-linoleic acid
0.001g
0.017g
N/A
Omega-6 - Dihomo-gamma-linoleic acid
0.002g
0g
N/A
Omega-6 - Eicosadienoic acid
0.009g
0.006g
N/A
Omega-6 - Linoleic acid
1.21g
3.573g
N/A
Macronutrient Comparison
Macronutrient breakdown side-by-side comparison
3
9%
12%
56%
22%
Protein:
9.42 g
Fats:
11.58 g
Carbs:
56.38 g
Water:
21.54 g
Other:
1.08 g
2
5%
25%
47%
21%
2%
Protein:
5.31 g
Fats:
24.93 g
Carbs:
47.06 g
Water:
20.82 g
Other:
1.88 g
Contains
more
Protein Protein
+77.4%
Contains
more
Carbs Carbs
+19.8%
Contains
more
Fats Fats
+115.3%
Contains
more
Other Other
+74.1%
Fat Type Comparison
Fat type breakdown side-by-side comparison
1
30%
49%
21%
Saturated fat:
Sat. Fat
2.183 g
Monounsaturated fat:
Mono. Fat
3.499 g
Polyunsaturated fat:
Poly. Fat
1.53 g
2
47%
36%
17%
Saturated fat:
Sat. Fat
11.105 g
Monounsaturated fat:
Mono. Fat
8.544 g
Polyunsaturated fat:
Poly. Fat
3.915 g
Contains
less
Sat. Fat Saturated fat
-80.3%
Contains
more
Mono. Fat Monounsaturated fat
+144.2%
Contains
more
Poly. Fat Polyunsaturated fat
+155.9%
Carbohydrate type comparison
Carbohydrate type breakdown side-by-side comparison
4
75%
8%
7%
8%
2%
Starch:
37.8 g
Sucrose:
3.86 g
Glucose:
3.58 g
Fructose:
4.05 g
Lactose:
0 g
Maltose:
1.01 g
Galactose:
0 g
2
59%
36%
2%
Starch:
25.91 g
Sucrose:
16.02 g
Glucose:
0.67 g
Fructose:
0 g
Lactose:
0.93 g
Maltose:
0.54 g
Galactose:
0 g
Contains
more
Starch Starch
+45.9%
Contains
more
Glucose Glucose
+434.3%
Contains
more
Fructose Fructose
+∞%
Contains
more
Maltose Maltose
+87%
Contains
more
Sucrose Sucrose
+315%
Contains
more
Lactose Lactose
+∞%