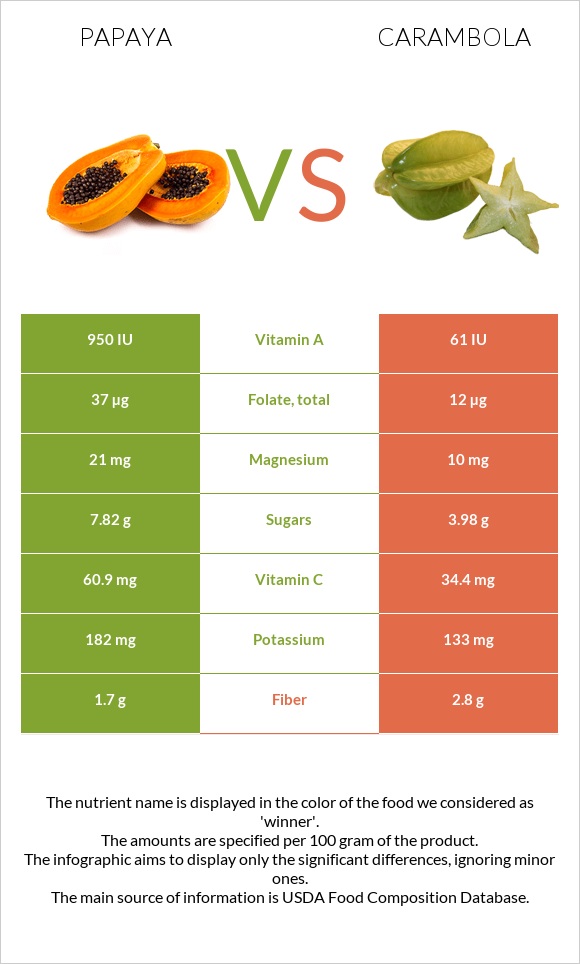
What are the main differences between papaya and carambola? Papaya is richer in vitamin C, vitamin A, and folate, yet carambola is richer in copper. Papaya's daily need coverage for vitamin C is 29% higher. Papaya has 16 times more vitamin A than carambola. Papaya has 950 IU of vitamin A, while carambola has 61 IU. Carambola contains less sugar. We used Papayas, raw and Carambola, (starfruit), raw types in this comparison.
Infographic
Mineral Comparison
Mineral comparison score is based on the number of minerals by which one or the other food is richer. The "coverage" charts below show how much of the daily needs can be covered by 300 grams of the food.
4
100 g
300 g
1 cup 1" pieces - 145g 1 fruit, small - 157g 1 cup, mashed - 230g 1 fruit, large - 781g
Magnesium
Magnesium
Calcium
Calcium
Potassium
Potassium
Iron
Iron
Copper
Copper
Zinc
Zinc
Phosphorus
Phosphorus
Sodium
Sodium
Manganese
Manganese
Selenium
Selenium
15%
6%
16%
9.4%
15%
2.2%
4.3%
1%
5.2%
3.3%
4
100 g
300 g
1 small (3-1/8" long) - 70g 1 medium (3-5/8" long) - 91g 1 cup, sliced - 108g 1 large (4-1/2" long) - 124g 1 cup, cubes - 132g
Magnesium
Magnesium
Calcium
Calcium
Potassium
Potassium
Iron
Iron
Copper
Copper
Zinc
Zinc
Phosphorus
Phosphorus
Sodium
Sodium
Manganese
Manganese
Selenium
Selenium
7.1%
0.9%
12%
3%
46%
3.3%
5.1%
0.26%
4.8%
3.3%
Vitamin Comparison
Vitamin comparison score is based on the number of vitamins by which one or the other food is richer. The "coverage" charts below show how much of the daily needs can be covered by 300 grams of the food.
8
100 g
300 g
1 cup 1" pieces - 145g 1 fruit, small - 157g 1 cup, mashed - 230g 1 fruit, large - 781g
Vitamin C
Vit. C
Vitamin D
Vit. D
Vitamin A
Vit. A
Vitamin E
Vit. E
Vitamin B1
Vit. B1
Vitamin B2
Vit. B2
Vitamin B3
Vit. B3
Vitamin B5
Vit. B5
Vitamin B6
Vit. B6
Vitamin B12
Vit. B12
Vitamin K
Vit. K
Folate
Folate
203%
0%
16%
6%
5.8%
6.2%
6.7%
11%
8.8%
0%
6.5%
28%
1
100 g
300 g
1 small (3-1/8" long) - 70g 1 medium (3-5/8" long) - 91g 1 cup, sliced - 108g 1 large (4-1/2" long) - 124g 1 cup, cubes - 132g
Vitamin C
Vit. C
Vitamin D
Vit. D
Vitamin A
Vit. A
Vitamin E
Vit. E
Vitamin B1
Vit. B1
Vitamin B2
Vit. B2
Vitamin B3
Vit. B3
Vitamin B5
Vit. B5
Vitamin B6
Vit. B6
Vitamin B12
Vit. B12
Vitamin K
Vit. K
Folate
Folate
115%
0%
1%
3%
3.5%
3.7%
6.9%
23%
3.9%
0%
0%
9%
All nutrients comparison - raw data values
Nutrient
DV% diff.
Vitamin C
60.9mg
34.4mg
29%
Copper
0.045mg
0.137mg
10%
Folate
37µg
12µg
6%
Vitamin A
47µg
3µg
5%
Fructose
3.73g
5%
Fiber
1.7g
2.8g
4%
Vitamin B5
0.191mg
0.391mg
4%
Magnesium
21mg
10mg
3%
Calcium
20mg
3mg
2%
Iron
0.25mg
0.08mg
2%
Vitamin B6
0.038mg
0.017mg
2%
Vitamin K
2.6µg
0µg
2%
Calories
43kcal
31kcal
1%
Protein
0.47g
1.04g
1%
Carbs
10.82g
6.73g
1%
Potassium
182mg
133mg
1%
Vitamin E
0.3mg
0.15mg
1%
Vitamin B1
0.023mg
0.014mg
1%
Vitamin B2
0.027mg
0.016mg
1%
Polyunsaturated fat
0.058g
0.184g
1%
Protein per 100 calories
1.1g
3.4g
N/A
Calories per 10 g protein
915kcal
298kcal
N/A
Weight per 100 calories
233g
323g
N/A
Fats
0.26g
0.33g
0%
Net carbs
9.12g
3.93g
N/A
Sugar
7.82g
3.98g
N/A
Zinc
0.08mg
0.12mg
0%
Phosphorus
10mg
12mg
0%
Sodium
8mg
2mg
0%
Manganese
0.04mg
0.037mg
0%
Selenium
0.6µg
0.6µg
0%
Vitamin B3
0.357mg
0.367mg
0%
Choline
6.1mg
7.6mg
0%
Saturated fat
0.081g
0.019g
0%
Monounsaturated fat
0.072g
0.03g
0%
Tryptophan
0.008mg
0.008mg
0%
Threonine
0.011mg
0.044mg
0%
Isoleucine
0.008mg
0.044mg
0%
Leucine
0.016mg
0.077mg
0%
Lysine
0.025mg
0.077mg
0%
Methionine
0.002mg
0.021mg
0%
Phenylalanine
0.009mg
0.037mg
0%
Valine
0.01mg
0.05mg
0%
Histidine
0.005mg
0.008mg
0%
Macronutrient Comparison
Macronutrient breakdown side-by-side comparison
1
11%
88%
Protein:
0.47 g
Fats:
0.26 g
Carbs:
10.82 g
Water:
88.06 g
Other:
0.39 g
4
7%
91%
Protein:
1.04 g
Fats:
0.33 g
Carbs:
6.73 g
Water:
91.38 g
Other:
0.52 g
Contains
more
Carbs Carbs
+60.8%
Contains
more
Protein Protein
+121.3%
Contains
more
Fats Fats
+26.9%
Contains
more
Other Other
+33.3%
Fat Type Comparison
Fat type breakdown side-by-side comparison
1
38%
34%
27%
Saturated fat:
Sat. Fat
0.081 g
Monounsaturated fat:
Mono. Fat
0.072 g
Polyunsaturated fat:
Poly. Fat
0.058 g
2
8%
13%
79%
Saturated fat:
Sat. Fat
0.019 g
Monounsaturated fat:
Mono. Fat
0.03 g
Polyunsaturated fat:
Poly. Fat
0.184 g
Contains
more
Mono. Fat Monounsaturated fat
+140%
Contains
less
Sat. Fat Saturated fat
-76.5%
Contains
more
Poly. Fat Polyunsaturated fat
+217.2%