A recap on the differences between pastry and filo Pastry is higher in vitamin K, monounsaturated fat, and polyunsaturated fat, yet filo is higher in vitamin B1, iron, and vitamin B5. Pastry covers your daily saturated fat needs 41% more than filo. Pastry contains 7 times more monounsaturated fat than filo. While pastry contains 21.597g of monounsaturated fat, filo contains only 3.149g. The amount of saturated fat in filo is lower. The glycemic index of filo is lower. Food varieties used in this article are Puff pastry, frozen, ready-to-bake and Phyllo dough .
Infographic
Mineral Comparison
Mineral comparison score is based on the number of minerals by which one or the other food is richer. The "coverage" charts below show how much of the daily needs can be covered by 300 grams of the food.
2
100 g
300 g
1 oz - 28.35g 1 shell - 47g
Magnesium
Magnesium
Calcium
Calcium
Potassium
Potassium
Iron
Iron
Copper
Copper
Zinc
Zinc
Phosphorus
Phosphorus
Sodium
Sodium
Manganese
Manganese
Selenium
Selenium
11%
3%
5.4%
96%
38%
14%
26%
32%
64%
132%
3
100 g
300 g
1 sheet dough - 19g 1 oz - 28.35g
Magnesium
Magnesium
Calcium
Calcium
Potassium
Potassium
Iron
Iron
Copper
Copper
Zinc
Zinc
Phosphorus
Phosphorus
Sodium
Sodium
Manganese
Manganese
Selenium
Selenium
11%
3.3%
6.5%
120%
34%
13%
32%
63%
62%
127%
Vitamin Comparison
Vitamin comparison score is based on the number of vitamins by which one or the other food is richer. The "coverage" charts below show how much of the daily needs can be covered by 300 grams of the food.
2
100 g
300 g
1 oz - 28.35g 1 shell - 47g
Vitamin C
Vit. C
Vitamin D
Vit. D
Vitamin A
Vit. A
Vitamin E
Vit. E
Vitamin B1
Vit. B1
Vitamin B2
Vit. B2
Vitamin B3
Vit. B3
Vitamin B5
Vit. B5
Vitamin B6
Vit. B6
Vitamin B12
Vit. B12
Vitamin K
Vit. K
Folate
Folate
0%
0%
0%
11%
100%
65%
78%
0%
4.8%
0%
40%
59%
5
100 g
300 g
1 sheet dough - 19g 1 oz - 28.35g
Vitamin C
Vit. C
Vitamin D
Vit. D
Vitamin A
Vit. A
Vitamin E
Vit. E
Vitamin B1
Vit. B1
Vitamin B2
Vit. B2
Vitamin B3
Vit. B3
Vitamin B5
Vit. B5
Vitamin B6
Vit. B6
Vitamin B12
Vit. B12
Vitamin K
Vit. K
Folate
Folate
0%
0%
0%
1.6%
135%
79%
76%
18%
6.9%
0%
6.3%
66%
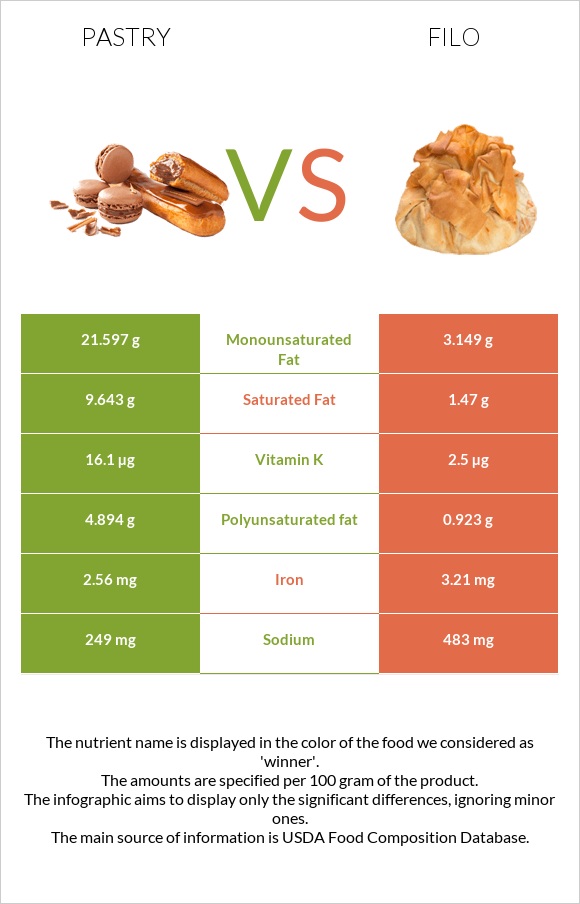
All nutrients comparison - raw data values
Nutrient
DV% diff.
Fats
38.1g
6g
49%
Monounsaturated fat
21.597g
3.149g
46%
Saturated fat
9.643g
1.47g
37%
Polyunsaturated fat
4.894g
0.923g
26%
Calories
551kcal
299kcal
13%
Vitamin B1
0.398mg
0.541mg
12%
Vitamin K
16.1µg
2.5µg
11%
Sodium
249mg
483mg
10%
Iron
2.56mg
3.21mg
8%
Vitamin B5
0mg
0.302mg
6%
Vitamin B2
0.283mg
0.341mg
4%
Carbs
45.1g
52.6g
3%
Vitamin E
0.54mg
0.08mg
3%
Folate
78µg
88µg
3%
Fiber
1.5g
1.9g
2%
Phosphorus
60mg
75mg
2%
Selenium
24.2µg
23.3µg
2%
Copper
0.114mg
0.101mg
1%
Manganese
0.488mg
0.476mg
1%
Vitamin B3
4.168mg
4.073mg
1%
Vitamin B6
0.021mg
0.03mg
1%
Protein
7.3g
7.1g
0%
Protein per 100 calories
1.3g
2.4g
N/A
Calories per 10 g protein
755kcal
421kcal
N/A
Weight per 100 calories
18g
33g
N/A
Unsaturated / Saturated Fat ratio
2.7
2.8
N/A
Net carbs
43.6g
50.7g
N/A
Magnesium
16mg
15mg
0%
Calcium
10mg
11mg
0%
Potassium
61mg
74mg
0%
Sugar
0.74g
0.18g
N/A
Zinc
0.53mg
0.49mg
0%
Choline
6.4mg
6.9mg
0%
Tryptophan
0.085mg
0.088mg
0%
Threonine
0.196mg
0.194mg
0%
Isoleucine
0.272mg
0.246mg
0%
Leucine
0.508mg
0.49mg
0%
Lysine
0.142mg
0.158mg
0%
Methionine
0.129mg
0.126mg
0%
Phenylalanine
0.362mg
0.359mg
0%
Valine
0.308mg
0.286mg
0%
Histidine
0.156mg
0.159mg
0%
Macronutrient Comparison
Macronutrient breakdown side-by-side comparison
2
7%
38%
45%
9%
Protein:
7.3 g
Fats:
38.1 g
Carbs:
45.1 g
Water:
8.5 g
Other:
1 g
3
7%
6%
53%
33%
2%
Protein:
7.1 g
Fats:
6 g
Carbs:
52.6 g
Water:
32.6 g
Other:
1.7 g
Contains
more
Fats Fats
+535%
Contains
more
Carbs Carbs
+16.6%
Contains
more
Water Water
+283.5%
Contains
more
Other Other
+70%
Fat Type Comparison
Fat type breakdown side-by-side comparison
2
27%
60%
14%
Saturated fat:
Sat. Fat
9.643 g
Monounsaturated fat:
Mono. Fat
21.597 g
Polyunsaturated fat:
Poly. Fat
4.894 g
1
27%
57%
17%
Saturated fat:
Sat. Fat
1.47 g
Monounsaturated fat:
Mono. Fat
3.149 g
Polyunsaturated fat:
Poly. Fat
0.923 g
Contains
more
Mono. Fat Monounsaturated fat
+585.8%
Contains
more
Poly. Fat Polyunsaturated fat
+430.2%
Contains
less
Sat. Fat Saturated fat
-84.8%