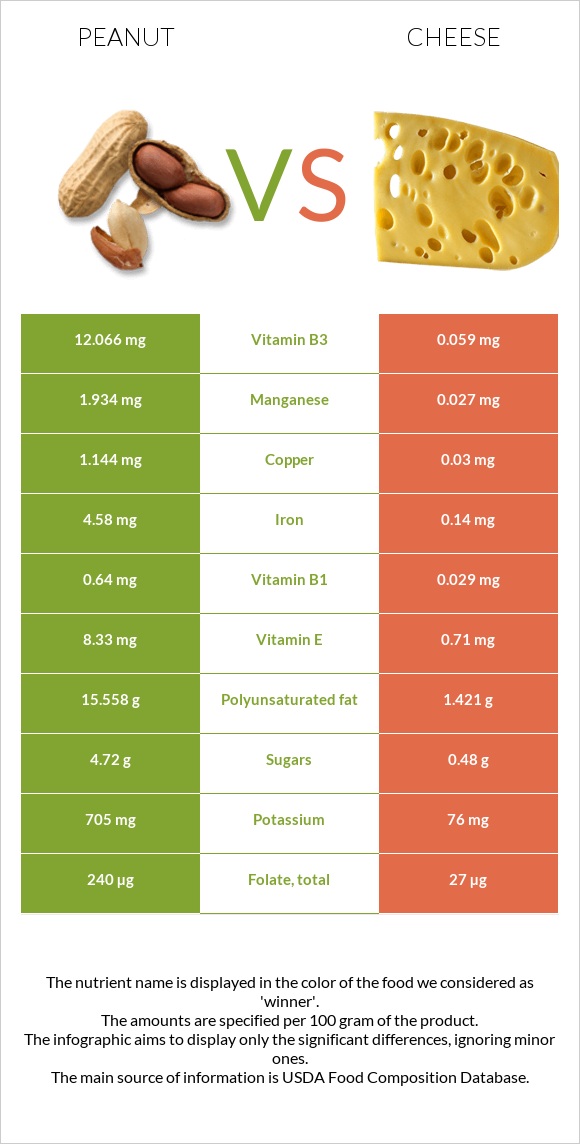
What are the main differences between peanuts and cheese? Peanuts are richer in copper, manganese, vitamin B3, iron, folate, vitamin B1, and vitamin E, while cheese is higher in calcium and vitamin B12. Peanuts' daily need coverage for copper is 124% higher. Cheese has 205 times less vitamin B3 than peanuts. Peanuts have 12.066mg of vitamin B3, while cheese has 0.059mg. Peanuts are lower in saturated fat. Peanuts have a higher glycemic index (13) than cheese (0). We used Peanuts, all types, raw and Cheese, cheddar types in this comparison.
Infographic
Mineral Comparison
Mineral comparison score is based on the number of minerals by which one or the other food is richer. The "coverage" charts below show how much of the daily needs can be covered by 300 grams of the food.
6
100 g
300 g
1 oz - 28.35g 1 cup - 146g
Magnesium
Magnesium
Calcium
Calcium
Potassium
Potassium
Iron
Iron
Copper
Copper
Zinc
Zinc
Phosphorus
Phosphorus
Sodium
Sodium
Manganese
Manganese
Selenium
Selenium
120%
28%
62%
172%
381%
89%
161%
2.3%
252%
39%
4
100 g
300 g
1 cubic inch - 17g 1 slice (1 oz) - 28g 1 oz - 28.35g 1 cup, shredded - 113g 1 cup, diced - 132g 1 cup, melted - 244g
Magnesium
Magnesium
Calcium
Calcium
Potassium
Potassium
Iron
Iron
Copper
Copper
Zinc
Zinc
Phosphorus
Phosphorus
Sodium
Sodium
Manganese
Manganese
Selenium
Selenium
19%
213%
6.7%
5.3%
10%
99%
195%
85%
3.5%
155%
Vitamin Comparison
Vitamin comparison score is based on the number of vitamins by which one or the other food is richer. The "coverage" charts below show how much of the daily needs can be covered by 300 grams of the food.
6
100 g
300 g
1 oz - 28.35g 1 cup - 146g
Vitamin C
Vit. C
Vitamin D
Vit. D
Vitamin A
Vit. A
Vitamin E
Vit. E
Vitamin B1
Vit. B1
Vitamin B2
Vit. B2
Vitamin B3
Vit. B3
Vitamin B5
Vit. B5
Vitamin B6
Vit. B6
Vitamin B12
Vit. B12
Vitamin K
Vit. K
Folate
Folate
0%
0%
0%
167%
160%
31%
226%
106%
80%
0%
0%
180%
5
100 g
300 g
1 cubic inch - 17g 1 slice (1 oz) - 28g 1 oz - 28.35g 1 cup, shredded - 113g 1 cup, diced - 132g 1 cup, melted - 244g
Vitamin C
Vit. C
Vitamin D
Vit. D
Vitamin A
Vit. A
Vitamin E
Vit. E
Vitamin B1
Vit. B1
Vitamin B2
Vit. B2
Vitamin B3
Vit. B3
Vitamin B5
Vit. B5
Vitamin B6
Vit. B6
Vitamin B12
Vit. B12
Vitamin K
Vit. K
Folate
Folate
0%
9%
110%
14%
7.3%
99%
1.1%
25%
15%
138%
6%
20%
All nutrients comparison - raw data values
Nutrient
DV% diff.
Copper
1.144mg
0.03mg
124%
Polyunsaturated fat
15.558g
1.421g
94%
Manganese
1.934mg
0.027mg
83%
Vitamin B3
12.066mg
0.059mg
75%
Calcium
92mg
710mg
62%
Saturated fat
6.279g
18.867g
57%
Iron
4.58mg
0.14mg
56%
Folate
240µg
27µg
53%
Vitamin E
8.33mg
0.71mg
51%
Vitamin B1
0.64mg
0.029mg
51%
Vitamin B12
0µg
1.1µg
46%
Selenium
7.2µg
28.5µg
39%
Monounsaturated fat
24.426g
9.246g
38%
Vitamin A
0µg
330µg
37%
Magnesium
168mg
27mg
34%
Fiber
8.5g
0g
34%
Cholesterol
0mg
99mg
33%
Sodium
18mg
653mg
28%
Vitamin B5
1.767mg
0.41mg
27%
Fats
49.24g
33.31g
25%
Vitamin B2
0.135mg
0.428mg
23%
Vitamin B6
0.348mg
0.066mg
22%
Potassium
705mg
76mg
19%
Phosphorus
376mg
455mg
11%
Calories
567kcal
404kcal
8%
Choline
52.5mg
16.5mg
7%
Protein
25.8g
22.87g
6%
Carbs
16.13g
3.09g
4%
Vitamin D*
0 IU
24 IU
3%
Vitamin D
0µg
0.6µg
3%
Zinc
3.27mg
3.64mg
3%
Vitamin K
0µg
2.4µg
2%
Protein per 100 calories
4.6g
5.7g
N/A
Calories per 10 g protein
220kcal
177kcal
N/A
Weight per 100 calories
18g
25g
N/A
Unsaturated / Saturated Fat ratio
6.4
0.57
N/A
Net carbs
7.63g
3.09g
N/A
Sugar
4.72g
0.48g
N/A
Trans fat
0g
0.917g
N/A
Tryptophan
0.25mg
0.547mg
0%
Threonine
0.883mg
1.044mg
0%
Isoleucine
0.907mg
1.206mg
0%
Leucine
1.672mg
1.939mg
0%
Lysine
0.926mg
1.025mg
0%
Methionine
0.317mg
0.547mg
0%
Phenylalanine
1.377mg
1.074mg
0%
Valine
1.082mg
1.404mg
0%
Histidine
0.652mg
0.547mg
0%
Omega-3 - EPA
0g
0.01g
N/A
Omega-3 - DHA
0g
0.001g
N/A
Omega-3 - DPA
0g
0.017g
N/A
Omega-6 - Eicosadienoic acid
0.007g
N/A
Macronutrient Comparison
Macronutrient breakdown side-by-side comparison
3
26%
49%
16%
7%
2%
Protein:
25.8 g
Fats:
49.24 g
Carbs:
16.13 g
Water:
6.5 g
Other:
2.33 g
2
23%
33%
3%
37%
4%
Protein:
22.87 g
Fats:
33.31 g
Carbs:
3.09 g
Water:
37.02 g
Other:
3.71 g
Contains
more
Protein Protein
+12.8%
Contains
more
Fats Fats
+47.8%
Contains
more
Carbs Carbs
+422%
Contains
more
Water Water
+469.5%
Contains
more
Other Other
+59.2%
Fat Type Comparison
Fat type breakdown side-by-side comparison
3
14%
53%
34%
Saturated fat:
Sat. Fat
6.279 g
Monounsaturated fat:
Mono. Fat
24.426 g
Polyunsaturated fat:
Poly. Fat
15.558 g
0
64%
31%
5%
Saturated fat:
Sat. Fat
18.867 g
Monounsaturated fat:
Mono. Fat
9.246 g
Polyunsaturated fat:
Poly. Fat
1.421 g
Contains
less
Sat. Fat Saturated fat
-66.7%
Contains
more
Mono. Fat Monounsaturated fat
+164.2%
Contains
more
Poly. Fat Polyunsaturated fat
+994.9%