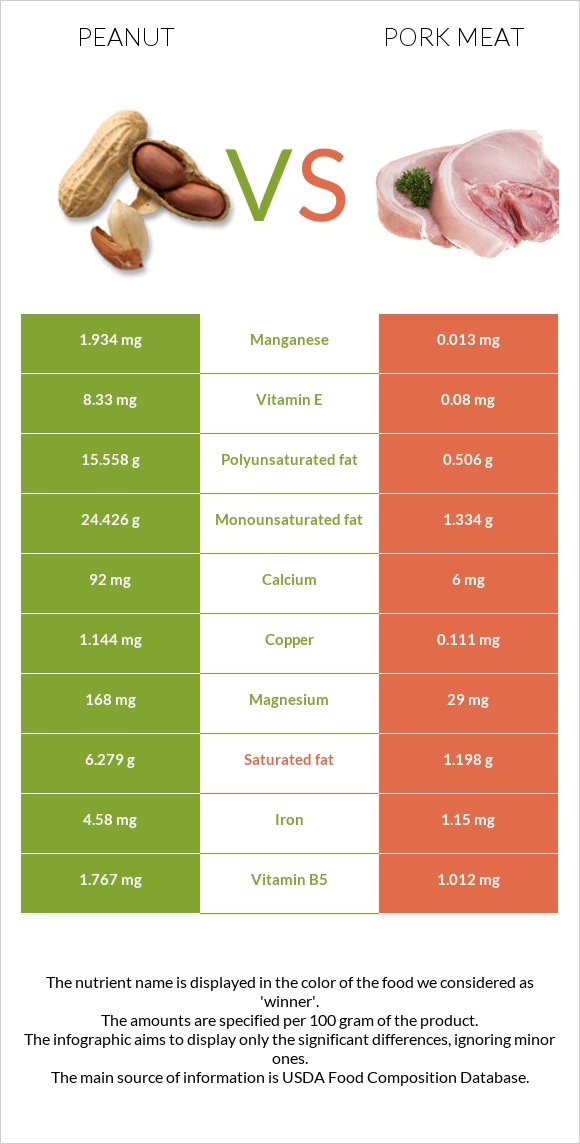
How are peanuts and pork Meat different? Peanuts are richer in copper, manganese, folate, vitamin E, iron, fiber, magnesium, and vitamin B3, while pork Meat is higher in selenium and vitamin B6. Peanuts cover your daily need for copper, 115% more than pork Meat. Peanuts have a higher glycemic index (13) than pork Meat (0). Peanuts, all types, raw and Pork, fresh, loin, tenderloin, separable lean only, cooked, roasted types were used in this article.
Infographic
Mineral Comparison
Mineral comparison score is based on the number of minerals by which one or the other food is richer. The "coverage" charts below show how much of the daily needs can be covered by 300 grams of the food.
9
100 g
300 g
1 oz - 28.35g 1 cup - 146g
Magnesium
Magnesium
Calcium
Calcium
Potassium
Potassium
Iron
Iron
Copper
Copper
Zinc
Zinc
Phosphorus
Phosphorus
Sodium
Sodium
Manganese
Manganese
Selenium
Selenium
120%
28%
62%
172%
381%
89%
161%
2.3%
252%
39%
1
100 g
300 g
3 oz - 85g 1 piece, cooked, excluding refuse (yield from 1 lb raw meat with refuse) - 333g 1 roast - 402g
Magnesium
Magnesium
Calcium
Calcium
Potassium
Potassium
Iron
Iron
Copper
Copper
Zinc
Zinc
Phosphorus
Phosphorus
Sodium
Sodium
Manganese
Manganese
Selenium
Selenium
21%
1.8%
37%
43%
37%
66%
114%
7.4%
1.7%
208%
Vitamin Comparison
Vitamin comparison score is based on the number of vitamins by which one or the other food is richer. The "coverage" charts below show how much of the daily needs can be covered by 300 grams of the food.
4
100 g
300 g
1 oz - 28.35g 1 cup - 146g
Vitamin C
Vit. C
Vitamin D
Vit. D
Vitamin A
Vit. A
Vitamin E
Vit. E
Vitamin B1
Vit. B1
Vitamin B2
Vit. B2
Vitamin B3
Vit. B3
Vitamin B5
Vit. B5
Vitamin B6
Vit. B6
Vitamin B12
Vit. B12
Vitamin K
Vit. K
Folate
Folate
0%
0%
0%
167%
160%
31%
226%
106%
80%
0%
0%
180%
5
100 g
300 g
3 oz - 85g 1 piece, cooked, excluding refuse (yield from 1 lb raw meat with refuse) - 333g 1 roast - 402g
Vitamin C
Vit. C
Vitamin D
Vit. D
Vitamin A
Vit. A
Vitamin E
Vit. E
Vitamin B1
Vit. B1
Vitamin B2
Vit. B2
Vitamin B3
Vit. B3
Vitamin B5
Vit. B5
Vitamin B6
Vit. B6
Vitamin B12
Vit. B12
Vitamin K
Vit. K
Folate
Folate
0%
3%
0%
1.6%
238%
89%
139%
61%
171%
71%
0%
0%
All nutrients comparison - raw data values
Nutrient
DV% diff.
Copper
1.144mg
0.111mg
115%
Polyunsaturated fat
15.558g
0.506g
100%
Manganese
1.934mg
0.013mg
84%
Fats
49.24g
3.51g
70%
Folate
240µg
0µg
60%
Monounsaturated fat
24.426g
1.334g
58%
Selenium
7.2µg
38.2µg
56%
Vitamin E
8.33mg
0.08mg
55%
Iron
4.58mg
1.15mg
43%
Fiber
8.5g
0g
34%
Magnesium
168mg
29mg
33%
Vitamin B6
0.348mg
0.739mg
30%
Vitamin B3
12.066mg
7.432mg
29%
Vitamin B1
0.64mg
0.95mg
26%
Cholesterol
0mg
73mg
24%
Vitamin B12
0µg
0.57µg
24%
Saturated fat
6.279g
1.198g
23%
Calories
567kcal
143kcal
21%
Vitamin B2
0.135mg
0.387mg
19%
Phosphorus
376mg
267mg
16%
Vitamin B5
1.767mg
1.012mg
15%
Calcium
92mg
6mg
9%
Potassium
705mg
421mg
8%
Zinc
3.27mg
2.42mg
8%
Choline
52.5mg
88.9mg
7%
Carbs
16.13g
0g
5%
Sodium
18mg
57mg
2%
Protein
25.8g
26.17g
1%
Vitamin D*
0 IU
10 IU
1%
Vitamin D
0µg
0.2µg
1%
Protein per 100 calories
4.6g
18g
N/A
Calories per 10 g protein
220kcal
55kcal
N/A
Weight per 100 calories
18g
70g
N/A
Unsaturated / Saturated Fat ratio
6.4
1.5
N/A
Net carbs
7.63g
0g
N/A
Sugar
4.72g
0g
N/A
Trans fat
0g
0.033g
N/A
Tryptophan
0.25mg
0.275mg
0%
Threonine
0.883mg
1.175mg
0%
Isoleucine
0.907mg
1.288mg
0%
Leucine
1.672mg
2.229mg
0%
Lysine
0.926mg
2.427mg
0%
Methionine
0.317mg
0.721mg
0%
Phenylalanine
1.377mg
1.1mg
0%
Valine
1.082mg
1.367mg
0%
Histidine
0.652mg
1.13mg
0%
Omega-3 - ALA
0.013g
N/A
Omega-6 - Eicosadienoic acid
0.013g
N/A
Omega-6 - Linoleic acid
0.411g
N/A
Macronutrient Comparison
Macronutrient breakdown side-by-side comparison
3
26%
49%
16%
7%
2%
Protein:
25.8 g
Fats:
49.24 g
Carbs:
16.13 g
Water:
6.5 g
Other:
2.33 g
2
26%
4%
69%
Protein:
26.17 g
Fats:
3.51 g
Carbs:
0 g
Water:
69.45 g
Other:
0.87 g
Contains
more
Fats Fats
+1302.8%
Contains
more
Carbs Carbs
+∞%
Contains
more
Other Other
+167.8%
Contains
more
Water Water
+968.5%
~equal in
Protein
~26.17g
Fat Type Comparison
Fat type breakdown side-by-side comparison
2
14%
53%
34%
Saturated fat:
Sat. Fat
6.279 g
Monounsaturated fat:
Mono. Fat
24.426 g
Polyunsaturated fat:
Poly. Fat
15.558 g
1
39%
44%
17%
Saturated fat:
Sat. Fat
1.198 g
Monounsaturated fat:
Mono. Fat
1.334 g
Polyunsaturated fat:
Poly. Fat
0.506 g
Contains
more
Mono. Fat Monounsaturated fat
+1731%
Contains
more
Poly. Fat Polyunsaturated fat
+2974.7%
Contains
less
Sat. Fat Saturated fat
-80.9%