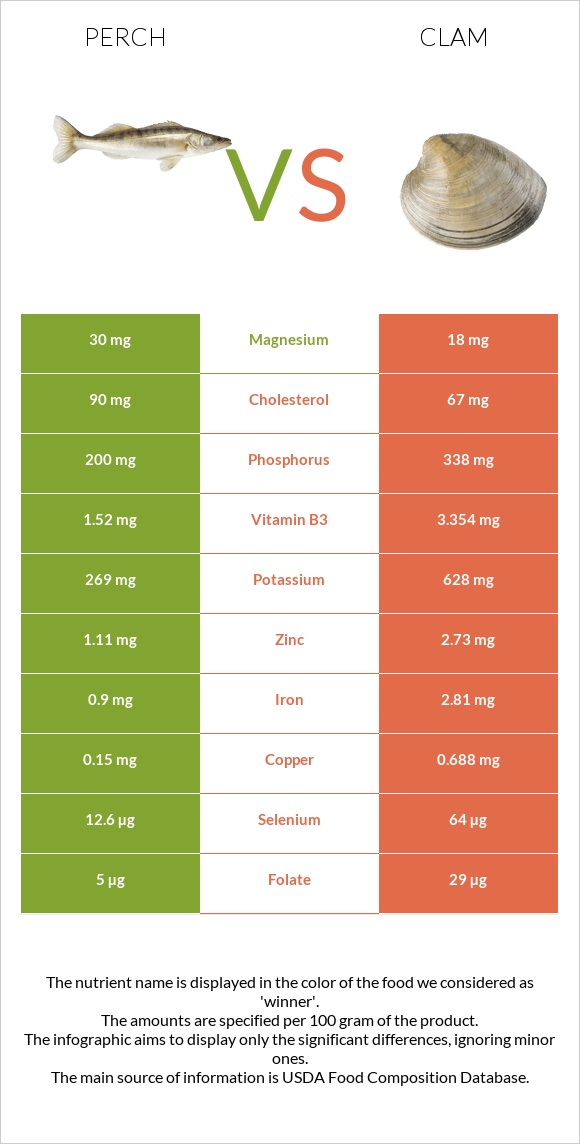
Significant differences between perch and clam The amount of vitamin B12, selenium, copper, vitamin B2, vitamin C, iron, zinc, and phosphorus in clam is higher than in perch. Clam covers your daily vitamin B12 needs 4029% more than perch. Clam has 2 times less cholesterol than perch. Perch has 115mg of cholesterol, while clam has 67mg. Clam has a higher glycemic index. The glycemic index of clam is 27, while the glycemic index of perch is 0. Specific food types used in this comparison are Fish, perch, mixed species, cooked, dry heat and Mollusks, clam, mixed species, cooked, moist heat .
Infographic
Mineral Comparison
Mineral comparison score is based on the number of minerals by which one or the other food is richer. The "coverage" charts below show how much of the daily needs can be covered by 300 grams of the food.
2
100 g
300 g
1 fillet - 46g 3 oz - 85g
Magnesium
Magnesium
Calcium
Calcium
Potassium
Potassium
Iron
Iron
Copper
Copper
Zinc
Zinc
Phosphorus
Phosphorus
Sodium
Sodium
Manganese
Manganese
Selenium
Selenium
27%
31%
30%
44%
64%
39%
110%
10%
117%
88%
7
100 g
300 g
3 oz - 85g 20 small - 190g
Magnesium
Magnesium
Calcium
Calcium
Potassium
Potassium
Iron
Iron
Copper
Copper
Zinc
Zinc
Phosphorus
Phosphorus
Sodium
Sodium
Manganese
Manganese
Selenium
Selenium
13%
28%
55%
105%
229%
74%
145%
157%
130%
349%
Vitamin Comparison
Vitamin comparison score is based on the number of vitamins by which one or the other food is richer. The "coverage" charts below show how much of the daily needs can be covered by 300 grams of the food.
2
100 g
300 g
1 fillet - 46g 3 oz - 85g
Vitamin C
Vit. C
Vitamin D
Vit. D
Vitamin A
Vit. A
Vitamin E
Vit. E
Vitamin B1
Vit. B1
Vitamin B2
Vit. B2
Vitamin B3
Vit. B3
Vitamin B5
Vit. B5
Vitamin B6
Vit. B6
Vitamin B12
Vit. B12
Vitamin K
Vit. K
Folate
Folate
5.7%
0%
3.3%
0%
20%
28%
36%
52%
32%
275%
0%
4.5%
7
100 g
300 g
3 oz - 85g 20 small - 190g
Vitamin C
Vit. C
Vitamin D
Vit. D
Vitamin A
Vit. A
Vitamin E
Vit. E
Vitamin B1
Vit. B1
Vitamin B2
Vit. B2
Vitamin B3
Vit. B3
Vitamin B5
Vit. B5
Vitamin B6
Vit. B6
Vitamin B12
Vit. B12
Vitamin K
Vit. K
Folate
Folate
74%
0%
57%
0%
38%
98%
63%
41%
25%
12361%
0%
22%
All nutrients comparison - raw data values
Nutrient
DV% diff.
Vitamin B12
2.2µg
98.89µg
4029%
Selenium
16.1µg
64µg
87%
Copper
0.192mg
0.688mg
55%
Sodium
79mg
1202mg
49%
Vitamin B2
0.12mg
0.426mg
24%
Vitamin C
1.7mg
22.1mg
23%
Iron
1.16mg
2.81mg
21%
Vitamin A
10µg
171µg
18%
Cholesterol
115mg
67mg
16%
Zinc
1.43mg
2.73mg
12%
Phosphorus
257mg
338mg
12%
Vitamin B3
1.9mg
3.354mg
9%
Potassium
344mg
628mg
8%
Vitamin B1
0.08mg
0.15mg
6%
Folate
6µg
29µg
6%
Magnesium
38mg
18mg
5%
Manganese
0.9mg
1mg
4%
Vitamin B5
0.87mg
0.68mg
4%
Calories
117kcal
148kcal
2%
Carbs
0g
5.13g
2%
Vitamin B6
0.14mg
0.11mg
2%
Protein
24.86g
25.55g
1%
Fats
1.18g
1.95g
1%
Calcium
102mg
92mg
1%
Polyunsaturated fat
0.472g
0.552g
1%
Protein per 100 calories
21g
17g
N/A
Calories per 10 g protein
47kcal
58kcal
N/A
Weight per 100 calories
85g
68g
N/A
Net carbs
0g
5.13g
N/A
Saturated fat
0.237g
0.188g
0%
Monounsaturated fat
0.195g
0.172g
0%
Tryptophan
0.278mg
0.286mg
0%
Threonine
1.09mg
1.099mg
0%
Isoleucine
1.145mg
1.112mg
0%
Leucine
2.02mg
1.798mg
0%
Lysine
2.283mg
1.909mg
0%
Methionine
0.736mg
0.576mg
0%
Phenylalanine
0.97mg
0.915mg
0%
Valine
1.281mg
1.116mg
0%
Histidine
0.732mg
0.49mg
0%
Omega-3 - EPA
0.101g
0.138g
N/A
Omega-3 - DHA
0.223g
0.146g
N/A
Omega-3 - DPA
0.036g
0.104g
N/A
Macronutrient Comparison
Macronutrient breakdown side-by-side comparison
1
25%
73%
Protein:
24.86 g
Fats:
1.18 g
Carbs:
0 g
Water:
73.25 g
Other:
0.71 g
4
26%
2%
5%
64%
4%
Protein:
25.55 g
Fats:
1.95 g
Carbs:
5.13 g
Water:
63.64 g
Other:
3.73 g
Contains
more
Water Water
+15.1%
Contains
more
Fats Fats
+65.3%
Contains
more
Carbs Carbs
+∞%
Contains
more
Other Other
+425.4%
~equal in
Protein
~25.55g
Fat Type Comparison
Fat type breakdown side-by-side comparison
1
26%
22%
52%
Saturated fat:
Sat. Fat
0.237 g
Monounsaturated fat:
Mono. Fat
0.195 g
Polyunsaturated fat:
Poly. Fat
0.472 g
2
21%
19%
61%
Saturated fat:
Sat. Fat
0.188 g
Monounsaturated fat:
Mono. Fat
0.172 g
Polyunsaturated fat:
Poly. Fat
0.552 g
Contains
more
Mono. Fat Monounsaturated fat
+13.4%
Contains
less
Sat. Fat Saturated fat
-20.7%
Contains
more
Poly. Fat Polyunsaturated fat
+16.9%