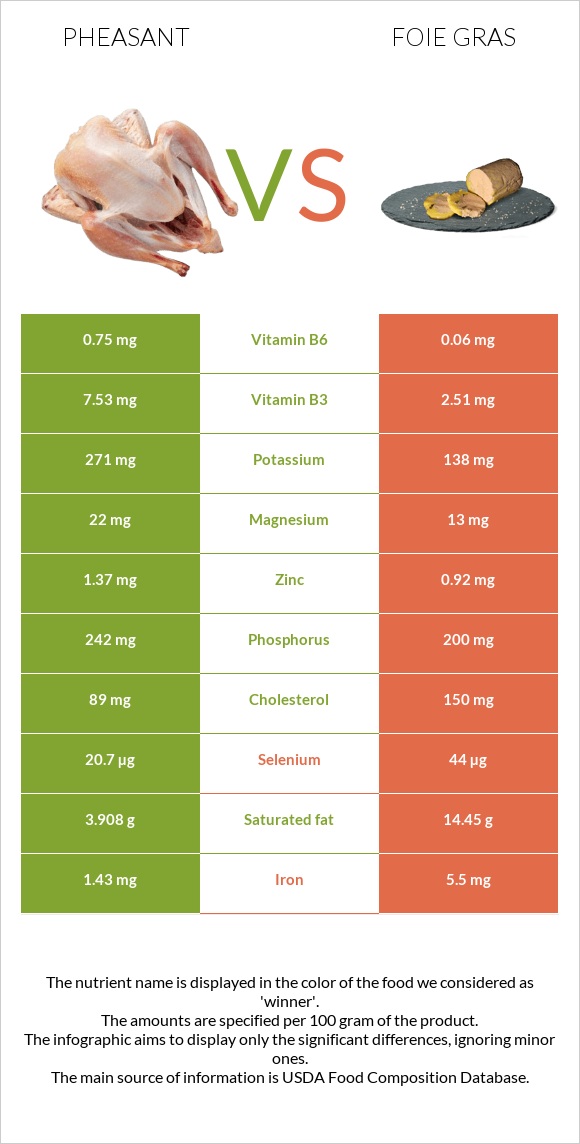
A recap on the differences between pheasant and foie gras Pheasant has more vitamin B6 and vitamin B3; however, foie gras is higher in vitamin B12, vitamin A, iron, selenium, and copper. Foie gras covers your daily vitamin B12 needs 362% more than pheasant. Foie gras contains 13 times less vitamin B6 than pheasant. Pheasant contains 0.75mg of vitamin B6, while foie gras contains 0.06mg. Pheasant has less cholesterol. Food varieties used in this article are Pheasant, cooked, total edible and Pate de foie gras, canned (goose liver pate), smoked .
Infographic
Mineral Comparison
Mineral comparison score is based on the number of minerals by which one or the other food is richer. The "coverage" charts below show how much of the daily needs can be covered by 300 grams of the food.
5
100 g
300 g
1 cup, chopped or diced - 140g
Magnesium
Magnesium
Calcium
Calcium
Potassium
Potassium
Iron
Iron
Copper
Copper
Zinc
Zinc
Phosphorus
Phosphorus
Sodium
Sodium
Manganese
Manganese
Selenium
Selenium
16%
4.8%
24%
54%
28%
37%
104%
5.6%
0%
113%
5
100 g
300 g
1 tbsp - 13g 1 oz - 28.35g
Magnesium
Magnesium
Calcium
Calcium
Potassium
Potassium
Iron
Iron
Copper
Copper
Zinc
Zinc
Phosphorus
Phosphorus
Sodium
Sodium
Manganese
Manganese
Selenium
Selenium
9.3%
21%
12%
206%
133%
25%
86%
91%
16%
240%
Vitamin Comparison
Vitamin comparison score is based on the number of vitamins by which one or the other food is richer. The "coverage" charts below show how much of the daily needs can be covered by 300 grams of the food.
6
100 g
300 g
1 cup, chopped or diced - 140g
Vitamin C
Vit. C
Vitamin D
Vit. D
Vitamin A
Vit. A
Vitamin E
Vit. E
Vitamin B1
Vit. B1
Vitamin B2
Vit. B2
Vitamin B3
Vit. B3
Vitamin B5
Vit. B5
Vitamin B6
Vit. B6
Vitamin B12
Vit. B12
Vitamin K
Vit. K
Folate
Folate
7.7%
3%
19%
5.4%
18%
42%
141%
0%
173%
90%
12%
3.8%
6
100 g
300 g
1 tbsp - 13g 1 oz - 28.35g
Vitamin C
Vit. C
Vitamin D
Vit. D
Vitamin A
Vit. A
Vitamin E
Vit. E
Vitamin B1
Vit. B1
Vitamin B2
Vit. B2
Vitamin B3
Vit. B3
Vitamin B5
Vit. B5
Vitamin B6
Vit. B6
Vitamin B12
Vit. B12
Vitamin K
Vit. K
Folate
Folate
6.7%
0%
334%
0%
22%
69%
47%
72%
14%
1175%
0%
45%
All nutrients comparison - raw data values
Nutrient
DV% diff.
Vitamin B12
0.72µg
9.4µg
362%
Vitamin A
57µg
1001µg
105%
Vitamin B6
0.75mg
0.06mg
53%
Iron
1.43mg
5.5mg
51%
Monounsaturated fat
5.627g
25.61g
50%
Fats
12.1g
43.84g
49%
Saturated fat
3.908g
14.45g
48%
Protein
32.4g
11.4g
42%
Selenium
20.7µg
44µg
42%
Copper
0.084mg
0.4mg
35%
Vitamin B3
7.53mg
2.51mg
31%
Sodium
43mg
697mg
28%
Vitamin B5
1.2mg
24%
Cholesterol
89mg
150mg
20%
Choline
85.8mg
16%
Folate
5µg
60µg
14%
Calories
239kcal
462kcal
11%
Vitamin B2
0.18mg
0.299mg
9%
Phosphorus
242mg
200mg
6%
Calcium
16mg
70mg
5%
Manganese
0.12mg
5%
Potassium
271mg
138mg
4%
Zinc
1.37mg
0.92mg
4%
Vitamin K
4.9µg
4%
Carbs
0g
4.67g
2%
Magnesium
22mg
13mg
2%
Vitamin E
0.27mg
2%
Vitamin B1
0.07mg
0.088mg
2%
Polyunsaturated fat
1.185g
0.84g
2%
Vitamin D*
7 IU
1%
Vitamin D
0.2µg
1%
Protein per 100 calories
14g
2.5g
N/A
Calories per 10 g protein
74kcal
405kcal
N/A
Weight per 100 calories
42g
22g
N/A
Unsaturated / Saturated Fat ratio
1.7
1.8
N/A
Vitamin C
2.3mg
2mg
0%
Net carbs
0g
4.67g
N/A
Tryptophan
0.161mg
0%
Threonine
0.507mg
0%
Isoleucine
0.606mg
0%
Leucine
1.029mg
0%
Lysine
0.863mg
0%
Methionine
0.27mg
0%
Phenylalanine
0.567mg
0%
Valine
0.719mg
0%
Histidine
0.303mg
0%
Macronutrient Comparison
Macronutrient breakdown side-by-side comparison
2
32%
12%
54%
Protein:
32.4 g
Fats:
12.1 g
Carbs:
0 g
Water:
54.2 g
Other:
1.3 g
3
11%
44%
5%
37%
3%
Protein:
11.4 g
Fats:
43.84 g
Carbs:
4.67 g
Water:
37.04 g
Other:
3.05 g
Contains
more
Protein Protein
+184.2%
Contains
more
Water Water
+46.3%
Contains
more
Fats Fats
+262.3%
Contains
more
Carbs Carbs
+∞%
Contains
more
Other Other
+134.6%
Fat Type Comparison
Fat type breakdown side-by-side comparison
2
36%
52%
11%
Saturated fat:
Sat. Fat
3.908 g
Monounsaturated fat:
Mono. Fat
5.627 g
Polyunsaturated fat:
Poly. Fat
1.185 g
1
35%
63%
2%
Saturated fat:
Sat. Fat
14.45 g
Monounsaturated fat:
Mono. Fat
25.61 g
Polyunsaturated fat:
Poly. Fat
0.84 g
Contains
less
Sat. Fat Saturated fat
-73%
Contains
more
Poly. Fat Polyunsaturated fat
+41.1%
Contains
more
Mono. Fat Monounsaturated fat
+355.1%