Pineapple vs. Red Bull — In-Depth Nutrition Comparison
Compare
Significant differences between pineapple and Red Bull
- Pineapple has more vitamin C, manganese, copper, and fiber; however, Red Bull is richer in vitamin B6, vitamin B12, vitamin B3, vitamin B5, and vitamin B2.
- Red Bull covers your daily vitamin B6 needs 158% more than pineapple.
Specific food types used in this comparison are Pineapple, raw, all varieties and Beverages, Energy drink, RED BULL.
Infographic
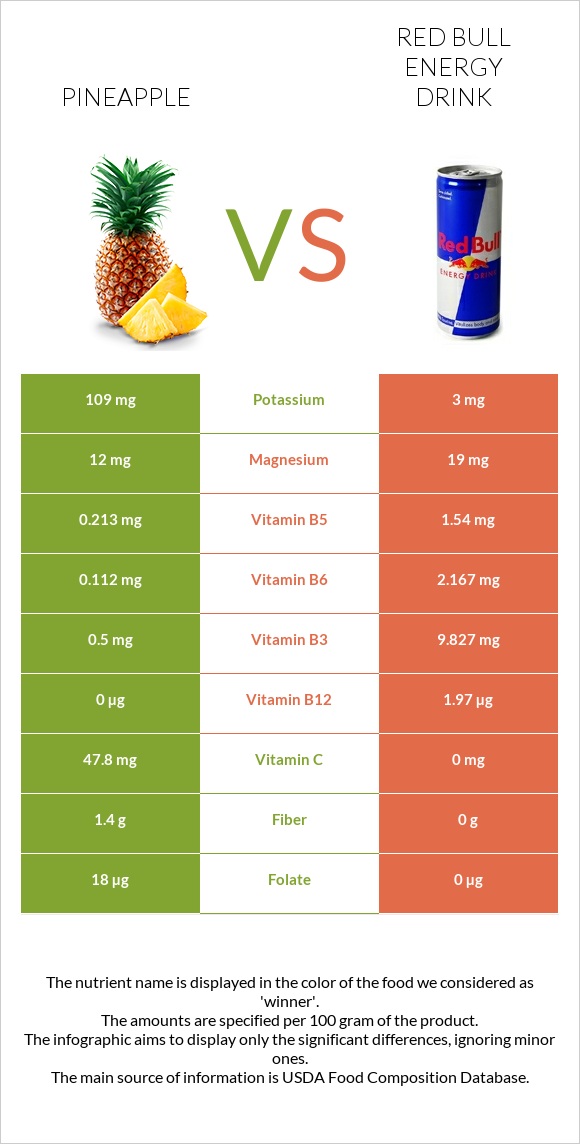
Infographic link
Mineral Comparison
Mineral comparison score is based on the number of minerals by which one or the other food is richer. The "coverage" charts below show how much of the daily needs can be covered by 300 grams of the food.
| Contains more CalciumCalcium | +116.7% |
| Contains more PotassiumPotassium | +3533.3% |
| Contains more IronIron | +383.3% |
| Contains more CopperCopper | +5400% |
| Contains more ZincZinc | +1100% |
| Contains more PhosphorusPhosphorus | +∞% |
| Contains less SodiumSodium | -97.4% |
| Contains more ManganeseManganese | +18440% |
| Contains more MagnesiumMagnesium | +58.3% |
| Contains more SeleniumSelenium | +100% |
Vitamin Comparison
Vitamin comparison score is based on the number of vitamins by which one or the other food is richer. The "coverage" charts below show how much of the daily needs can be covered by 300 grams of the food.
| Contains more Vitamin CVitamin C | +∞% |
| Contains more Vitamin AVitamin A | +∞% |
| Contains more Vitamin EVitamin E | +∞% |
| Contains more Vitamin B1Vitamin B1 | +97.5% |
| Contains more Vitamin KVitamin K | +∞% |
| Contains more FolateFolate | +∞% |
| Contains more Vitamin B2Vitamin B2 | +221.9% |
| Contains more Vitamin B3Vitamin B3 | +1865.4% |
| Contains more Vitamin B5Vitamin B5 | +623% |
| Contains more Vitamin B6Vitamin B6 | +1834.8% |
| Contains more Vitamin B12Vitamin B12 | +∞% |
All nutrients comparison - raw data values
| Nutrient |  |
 |
DV% diff. |
| Vitamin B6 | 0.112mg | 2.167mg | 158% |
| Vitamin B12 | 0µg | 1.97µg | 82% |
| Vitamin B3 | 0.5mg | 9.827mg | 58% |
| Vitamin C | 47.8mg | 0mg | 53% |
| Manganese | 0.927mg | 0.005mg | 40% |
| Vitamin B5 | 0.213mg | 1.54mg | 27% |
| Copper | 0.11mg | 0.002mg | 12% |
| Caffeine | 0mg | 29mg | 7% |
| Fiber | 1.4g | 0g | 6% |
| Vitamin B2 | 0.032mg | 0.103mg | 5% |
| Folate | 18µg | 0µg | 5% |
| Potassium | 109mg | 3mg | 3% |
| Iron | 0.29mg | 0.06mg | 3% |
| Vitamin B1 | 0.079mg | 0.04mg | 3% |
| Magnesium | 12mg | 19mg | 2% |
| Sodium | 1mg | 39mg | 2% |
| Carbs | 13.12g | 10.23g | 1% |
| Calcium | 13mg | 6mg | 1% |
| Zinc | 0.12mg | 0.01mg | 1% |
| Phosphorus | 8mg | 0mg | 1% |
| Vitamin K | 0.7µg | 0µg | 1% |
| Choline | 5.5mg | 0.3mg | 1% |
| Fructose | 2.12g | 1.63g | 1% |
| Calories | 50kcal | 43kcal | 0% |
| Protein | 0.54g | 0.46g | 0% |
| Fats | 0.12g | 0g | 0% |
| Net carbs | 11.72g | 10.23g | N/A |
| Sugar | 9.85g | 10.22g | N/A |
| Vitamin A | 3µg | 0µg | 0% |
| Vitamin E | 0.02mg | 0mg | 0% |
| Selenium | 0.1µg | 0.2µg | 0% |
| Saturated fat | 0.009g | 0g | 0% |
| Monounsaturated fat | 0.013g | 0g | 0% |
| Polyunsaturated fat | 0.04g | 0g | 0% |
| Tryptophan | 0.005mg | 0% | |
| Threonine | 0.019mg | 0% | |
| Isoleucine | 0.019mg | 0% | |
| Leucine | 0.024mg | 0% | |
| Lysine | 0.026mg | 0% | |
| Methionine | 0.012mg | 0% | |
| Phenylalanine | 0.021mg | 0% | |
| Valine | 0.024mg | 0% | |
| Histidine | 0.01mg | 0% |
Macronutrient Comparison
Macronutrient breakdown side-by-side comparison
| Contains more ProteinProtein | +17.4% |
| Contains more FatsFats | +∞% |
| Contains more CarbsCarbs | +28.3% |
| Contains more OtherOther | +144.4% |
~equal in
Water
~89.22g
Carbohydrate type comparison
Carbohydrate type breakdown side-by-side comparison
| Contains more SucroseSucrose | +15.4% |
| Contains more FructoseFructose | +30.1% |
| Contains more GlucoseGlucose | +96.5% |
~equal in
Starch
~0g
~equal in
Lactose
~0g
~equal in
Maltose
~0g
~equal in
Galactose
~0g


