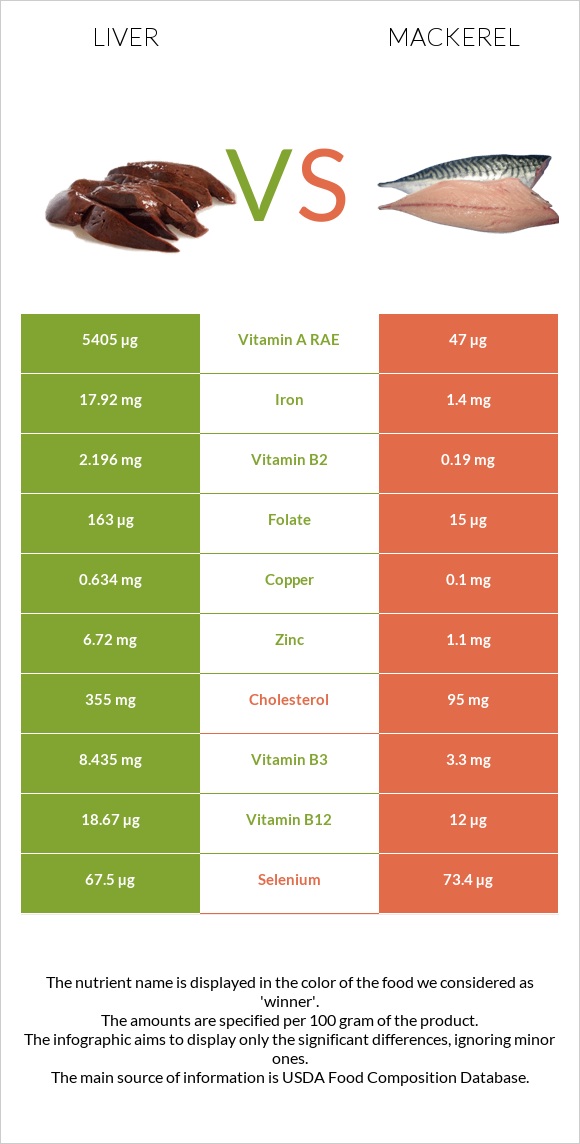
Differences between liver and mackerel Liver is higher than mackerel in vitamin A, vitamin B12, iron, vitamin B2, copper, zinc, folate, and vitamin B3. Liver's daily need coverage for vitamin A is 357% higher. Liver has 13 times more iron than mackerel. While liver has 17.92mg of iron, mackerel has only 1.4mg. Mackerel has less cholesterol. The food types used in this comparison are Pork, fresh, variety meats, and by-products, liver, cooked, braised and Fish, mackerel, salted .
Infographic
Mineral Comparison
Mineral comparison score is based on the number of minerals by which one or the other food is richer. The "coverage" charts below show how much of the daily needs can be covered by 300 grams of the food.
5
100 g
300 g
3 oz - 85g
Magnesium
Magnesium
Calcium
Calcium
Potassium
Potassium
Iron
Iron
Copper
Copper
Zinc
Zinc
Phosphorus
Phosphorus
Sodium
Sodium
Manganese
Manganese
Selenium
Selenium
10%
3%
13%
672%
211%
183%
103%
6.4%
39%
368%
3
100 g
300 g
1 cubic inch, boneless - 17g 1 piece (5-1/2" x 1-1/2" x 1/2") - 80g 1 cup, cooked - 136g
Magnesium
Magnesium
Calcium
Calcium
Potassium
Potassium
Iron
Iron
Copper
Copper
Zinc
Zinc
Phosphorus
Phosphorus
Sodium
Sodium
Manganese
Manganese
Selenium
Selenium
43%
20%
46%
53%
33%
30%
109%
580%
0%
400%
Vitamin Comparison
Vitamin comparison score is based on the number of vitamins by which one or the other food is richer. The "coverage" charts below show how much of the daily needs can be covered by 300 grams of the food.
9
100 g
300 g
3 oz - 85g
Vitamin C
Vit. C
Vitamin D
Vit. D
Vitamin A
Vit. A
Vitamin E
Vit. E
Vitamin B1
Vit. B1
Vitamin B2
Vit. B2
Vitamin B3
Vit. B3
Vitamin B5
Vit. B5
Vitamin B6
Vit. B6
Vitamin B12
Vit. B12
Vitamin K
Vit. K
Folate
Folate
79%
0%
1802%
0%
65%
507%
158%
286%
132%
2334%
0%
122%
3
100 g
300 g
1 cubic inch, boneless - 17g 1 piece (5-1/2" x 1-1/2" x 1/2") - 80g 1 cup, cooked - 136g
Vitamin C
Vit. C
Vitamin D
Vit. D
Vitamin A
Vit. A
Vitamin E
Vit. E
Vitamin B1
Vit. B1
Vitamin B2
Vit. B2
Vitamin B3
Vit. B3
Vitamin B5
Vit. B5
Vitamin B6
Vit. B6
Vitamin B12
Vit. B12
Vitamin K
Vit. K
Folate
Folate
0%
378%
16%
48%
5%
44%
62%
0%
95%
1500%
20%
11%
All nutrients comparison - raw data values
Nutrient
DV% diff.
Vitamin A
5405µg
47µg
595%
Vitamin B12
18.67µg
12µg
278%
Iron
17.92mg
1.4mg
207%
Sodium
49mg
4450mg
191%
Vitamin B2
2.196mg
0.19mg
154%
Vitamin D*
1006 IU
126%
Vitamin D
25.2µg
126%
Vitamin B5
4.774mg
95%
Cholesterol
355mg
95mg
87%
Copper
0.634mg
0.1mg
59%
Zinc
6.72mg
1.1mg
51%
Folate
163µg
15µg
37%
Polyunsaturated fat
1.05g
6.21g
34%
Fats
4.4g
25.1g
32%
Vitamin B3
8.435mg
3.3mg
32%
Vitamin C
23.6mg
0mg
26%
Saturated fat
1.41g
7.148g
26%
Vitamin B1
0.258mg
0.02mg
20%
Monounsaturated fat
0.63g
8.32g
19%
Choline
101.6mg
18%
Vitamin E
2.38mg
16%
Protein
26.02g
18.5g
15%
Manganese
0.3mg
13%
Vitamin B6
0.57mg
0.41mg
12%
Magnesium
14mg
60mg
11%
Potassium
150mg
520mg
11%
Selenium
67.5µg
73.4µg
11%
Calories
165kcal
305kcal
7%
Vitamin K
7.8µg
7%
Calcium
10mg
66mg
6%
Phosphorus
241mg
254mg
2%
Carbs
3.76g
0g
1%
Protein per 100 calories
16g
6.1g
N/A
Calories per 10 g protein
63kcal
165kcal
N/A
Weight per 100 calories
61g
33g
N/A
Unsaturated / Saturated Fat ratio
1.2
2
N/A
Net carbs
3.76g
0g
N/A
Tryptophan
0.366mg
0%
Threonine
1.107mg
0%
Isoleucine
1.32mg
0%
Leucine
2.319mg
0%
Lysine
2.007mg
0%
Methionine
0.645mg
0%
Phenylalanine
1.274mg
0%
Valine
1.607mg
0%
Histidine
0.708mg
0%
Omega-3 - EPA
0g
1.619g
N/A
Omega-3 - DHA
0.03g
2.965g
N/A
Omega-3 - DPA
0.04g
0.391g
N/A
Macronutrient Comparison
Macronutrient breakdown side-by-side comparison
3
26%
4%
4%
64%
Protein:
26.02 g
Fats:
4.4 g
Carbs:
3.76 g
Water:
64.32 g
Other:
1.5 g
2
19%
25%
43%
13%
Protein:
18.5 g
Fats:
25.1 g
Carbs:
0 g
Water:
43 g
Other:
13.4 g
Contains
more
Protein Protein
+40.6%
Contains
more
Carbs Carbs
+∞%
Contains
more
Water Water
+49.6%
Contains
more
Fats Fats
+470.5%
Contains
more
Other Other
+793.3%
Fat Type Comparison
Fat type breakdown side-by-side comparison
1
46%
20%
34%
Saturated fat:
Sat. Fat
1.41 g
Monounsaturated fat:
Mono. Fat
0.63 g
Polyunsaturated fat:
Poly. Fat
1.05 g
2
33%
38%
29%
Saturated fat:
Sat. Fat
7.148 g
Monounsaturated fat:
Mono. Fat
8.32 g
Polyunsaturated fat:
Poly. Fat
6.21 g
Contains
less
Sat. Fat Saturated fat
-80.3%
Contains
more
Mono. Fat Monounsaturated fat
+1220.6%
Contains
more
Poly. Fat Polyunsaturated fat
+491.4%