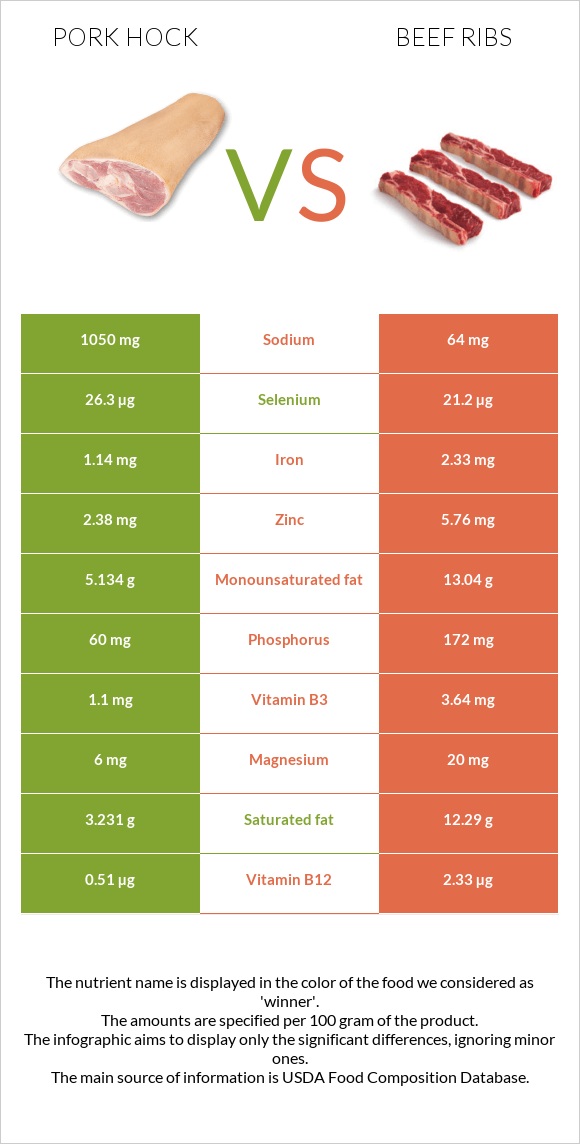
The main differences between pork hock and beef ribs Pork hock is richer in selenium, yet beef ribs are richer in vitamin B12, zinc, phosphorus, vitamin B3, iron, vitamin B6, and vitamin B2. Daily need coverage for vitamin B12 for beef ribs is 76% higher. Pork hock contains 16 times more sodium than beef ribs. Pork hock contains 1050mg of sodium, while beef ribs contain 64mg. Food types used in this article are Pork, pickled pork hocks and Beef, rib, large end (ribs 6-9), separable lean, and fat, trimmed to 0" fat, choice, cooked, roasted .
Infographic
Mineral Comparison
Mineral comparison score is based on the number of minerals by which one or the other food is richer. The "coverage" charts below show how much of the daily needs can be covered by 300 grams of the food.
3
100 g
300 g
3 oz - 117g
Magnesium
Magnesium
Calcium
Calcium
Potassium
Potassium
Iron
Iron
Copper
Copper
Zinc
Zinc
Phosphorus
Phosphorus
Sodium
Sodium
Manganese
Manganese
Selenium
Selenium
4.3%
5.7%
4.1%
43%
27%
65%
26%
137%
2.9%
143%
6
100 g
300 g
3 oz - 85g 1 piece, cooked, excluding refuse (yield from 1 lb raw meat with refuse) - 290g
Magnesium
Magnesium
Calcium
Calcium
Potassium
Potassium
Iron
Iron
Copper
Copper
Zinc
Zinc
Phosphorus
Phosphorus
Sodium
Sodium
Manganese
Manganese
Selenium
Selenium
14%
3%
26%
87%
29%
157%
74%
8.3%
1.7%
116%
Vitamin Comparison
Vitamin comparison score is based on the number of vitamins by which one or the other food is richer. The "coverage" charts below show how much of the daily needs can be covered by 300 grams of the food.
3
100 g
300 g
3 oz - 117g
Vitamin C
Vit. C
Vitamin D
Vit. D
Vitamin A
Vit. A
Vitamin E
Vit. E
Vitamin B1
Vit. B1
Vitamin B2
Vit. B2
Vitamin B3
Vit. B3
Vitamin B5
Vit. B5
Vitamin B6
Vit. B6
Vitamin B12
Vit. B12
Vitamin K
Vit. K
Folate
Folate
0%
0%
7.7%
3.4%
20%
16%
21%
21%
15%
64%
0%
0.75%
5
100 g
300 g
3 oz - 85g 1 piece, cooked, excluding refuse (yield from 1 lb raw meat with refuse) - 290g
Vitamin C
Vit. C
Vitamin D
Vit. D
Vitamin A
Vit. A
Vitamin E
Vit. E
Vitamin B1
Vit. B1
Vitamin B2
Vit. B2
Vitamin B3
Vit. B3
Vitamin B5
Vit. B5
Vitamin B6
Vit. B6
Vitamin B12
Vit. B12
Vitamin K
Vit. K
Folate
Folate
0%
0%
0%
0%
18%
44%
68%
22%
53%
291%
0%
5.3%
All nutrients comparison - raw data values
Nutrient
DV% diff.
Vitamin B12
0.51µg
2.33µg
76%
Sodium
1050mg
64mg
43%
Saturated fat
3.231g
12.29g
41%
Fats
10.54g
30.49g
31%
Zinc
2.38mg
5.76mg
31%
Monounsaturated fat
5.134g
13.04g
20%
Phosphorus
60mg
172mg
16%
Vitamin B3
1.1mg
3.64mg
16%
Iron
1.14mg
2.33mg
15%
Vitamin B6
0.064mg
0.23mg
13%
Calories
171kcal
372kcal
10%
Selenium
26.3µg
21.2µg
9%
Vitamin B2
0.068mg
0.19mg
9%
Protein
19.11g
22.8g
7%
Potassium
47mg
290mg
7%
Magnesium
6mg
20mg
3%
Vitamin A
23µg
0µg
3%
Folate
1µg
7µg
2%
Cholesterol
89mg
85mg
1%
Calcium
19mg
10mg
1%
Copper
0.082mg
0.088mg
1%
Vitamin E
0.17mg
1%
Vitamin B1
0.08mg
0.07mg
1%
Vitamin B5
0.344mg
0.37mg
1%
Polyunsaturated fat
1.198g
1.05g
1%
Protein per 100 calories
11g
6.1g
N/A
Calories per 10 g protein
89kcal
163kcal
N/A
Weight per 100 calories
58g
27g
N/A
Unsaturated / Saturated Fat ratio
2
1.1
N/A
Manganese
0.022mg
0.013mg
0%
Trans fat
0.113g
N/A
Tryptophan
0.038mg
0.255mg
0%
Threonine
0.516mg
0.996mg
0%
Isoleucine
0.325mg
1.025mg
0%
Leucine
0.841mg
1.802mg
0%
Lysine
0.822mg
1.897mg
0%
Methionine
0.211mg
0.584mg
0%
Phenylalanine
0.554mg
0.89mg
0%
Valine
0.478mg
1.109mg
0%
Histidine
0.211mg
0.781mg
0%
Omega-3 - ALA
0.042g
N/A
Omega-6 - Eicosadienoic acid
0.045g
N/A
Omega-6 - Linoleic acid
0.986g
N/A
Macronutrient Comparison
Macronutrient breakdown side-by-side comparison
2
19%
11%
68%
2%
Protein:
19.11 g
Fats:
10.54 g
Carbs:
0 g
Water:
68.02 g
Other:
2.33 g
2
23%
30%
46%
Protein:
22.8 g
Fats:
30.49 g
Carbs:
0 g
Water:
46.1 g
Other:
0.61 g
Contains
more
Water Water
+47.5%
Contains
more
Other Other
+282%
Contains
more
Protein Protein
+19.3%
Contains
more
Fats Fats
+189.3%
Fat Type Comparison
Fat type breakdown side-by-side comparison
2
34%
54%
13%
Saturated fat:
Sat. Fat
3.231 g
Monounsaturated fat:
Mono. Fat
5.134 g
Polyunsaturated fat:
Poly. Fat
1.198 g
1
47%
49%
4%
Saturated fat:
Sat. Fat
12.29 g
Monounsaturated fat:
Mono. Fat
13.04 g
Polyunsaturated fat:
Poly. Fat
1.05 g
Contains
less
Sat. Fat Saturated fat
-73.7%
Contains
more
Poly. Fat Polyunsaturated fat
+14.1%
Contains
more
Mono. Fat Monounsaturated fat
+154%