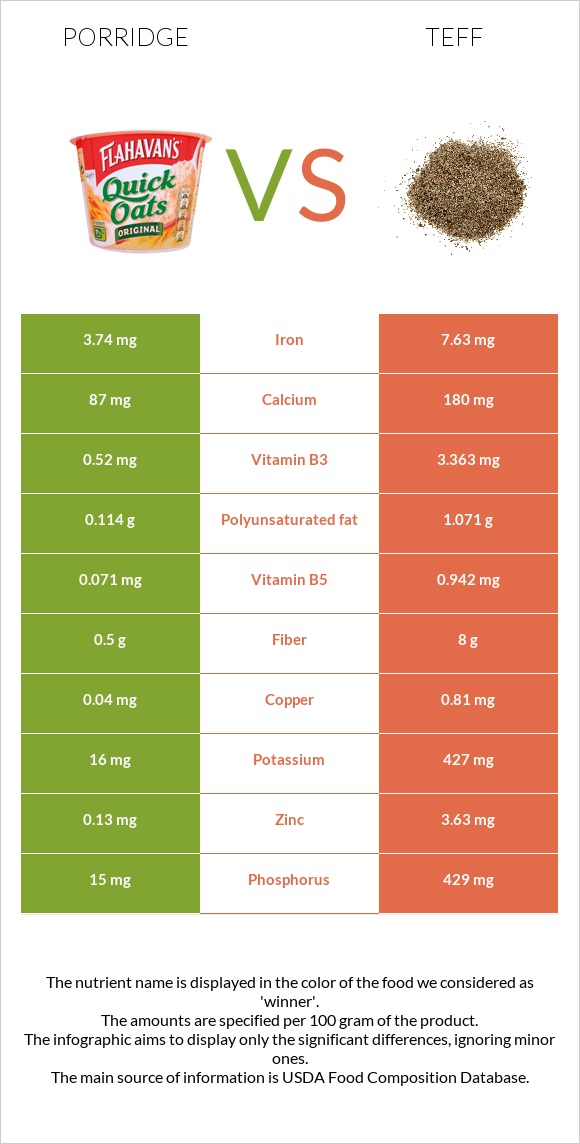
What are the main differences between porridge and teff? Porridge is richer in iron, yet teff is richer in manganese, copper, phosphorus, magnesium, vitamin B1, fiber, zinc, and vitamin B6. Teff's daily need coverage for manganese is 124% higher. Porridge has 2 times more iron than teff. Porridge has 3.74mg of iron, while teff has 2.05mg. We used Cereals, CREAM OF WHEAT, regular (10 minute), cooked with water, without salt and Teff, cooked types in this comparison.
Infographic
Mineral Comparison
Mineral comparison score is based on the number of minerals by which one or the other food is richer. The "coverage" charts below show how much of the daily needs can be covered by 300 grams of the food.
4
100 g
300 g
1 tbsp - 16g 1 cup (1 serving) - 251g
Magnesium
Magnesium
Calcium
Calcium
Potassium
Potassium
Iron
Iron
Copper
Copper
Zinc
Zinc
Phosphorus
Phosphorus
Sodium
Sodium
Manganese
Manganese
Selenium
Selenium
3.6%
26%
1.4%
140%
13%
3.5%
6.4%
0.78%
0%
15%
6
100 g
300 g
1 cup - 252g
Magnesium
Magnesium
Calcium
Calcium
Potassium
Potassium
Iron
Iron
Copper
Copper
Zinc
Zinc
Phosphorus
Phosphorus
Sodium
Sodium
Manganese
Manganese
Selenium
Selenium
36%
15%
9.4%
77%
75%
30%
51%
1%
373%
0%
Vitamin Comparison
Vitamin comparison score is based on the number of vitamins by which one or the other food is richer. The "coverage" charts below show how much of the daily needs can be covered by 300 grams of the food.
3
100 g
300 g
1 tbsp - 16g 1 cup (1 serving) - 251g
Vitamin C
Vit. C
Vitamin D
Vit. D
Vitamin A
Vit. A
Vitamin E
Vit. E
Vitamin B1
Vit. B1
Vitamin B2
Vit. B2
Vitamin B3
Vit. B3
Vitamin B5
Vit. B5
Vitamin B6
Vit. B6
Vitamin B12
Vit. B12
Vitamin K
Vit. K
Folate
Folate
0%
0%
0%
0.4%
14%
5.8%
9.8%
4.3%
3%
0%
0.25%
9%
5
100 g
300 g
1 cup - 252g
Vitamin C
Vit. C
Vitamin D
Vit. D
Vitamin A
Vit. A
Vitamin E
Vit. E
Vitamin B1
Vit. B1
Vitamin B2
Vit. B2
Vitamin B3
Vit. B3
Vitamin B5
Vit. B5
Vitamin B6
Vit. B6
Vitamin B12
Vit. B12
Vitamin K
Vit. K
Folate
Folate
0%
0%
0%
0%
46%
7.6%
17%
0%
22%
0%
0%
14%
All nutrients comparison - raw data values
Nutrient
DV% diff.
Manganese
0mg
2.86mg
124%
Iron
3.74mg
2.05mg
21%
Copper
0.04mg
0.226mg
21%
Phosphorus
15mg
120mg
15%
Magnesium
5mg
50mg
11%
Vitamin B1
0.055mg
0.183mg
11%
Fiber
0.5g
2.8g
9%
Zinc
0.13mg
1.11mg
9%
Vitamin B6
0.013mg
0.097mg
6%
Protein
1.44g
3.87g
5%
Selenium
2.8µg
5%
Calcium
87mg
49mg
4%
Calories
50kcal
101kcal
3%
Carbs
10.52g
19.86g
3%
Potassium
16mg
107mg
3%
Vitamin B3
0.52mg
0.909mg
2%
Folate
12µg
18µg
2%
Fats
0.21g
0.65g
1%
Vitamin B2
0.025mg
0.033mg
1%
Vitamin B5
0.071mg
1%
Polyunsaturated fat
0.114g
1%
Protein per 100 calories
2.9g
3.8g
N/A
Calories per 10 g protein
347kcal
261kcal
N/A
Weight per 100 calories
200g
99g
N/A
Net carbs
10.02g
17.06g
N/A
Sugar
0.03g
N/A
Sodium
6mg
8mg
0%
Vitamin E
0.02mg
0%
Vitamin K
0.1µg
0%
Saturated fat
0.033g
0%
Monounsaturated fat
0.028g
0%
Tryptophan
0.02mg
0.041mg
0%
Threonine
0.045mg
0.149mg
0%
Isoleucine
0.063mg
0.146mg
0%
Leucine
0.11mg
0.311mg
0%
Lysine
0.037mg
0.109mg
0%
Methionine
0.027mg
0.125mg
0%
Phenylalanine
0.078mg
0.203mg
0%
Valine
0.07mg
0.2mg
0%
Histidine
0.033mg
0.088mg
0%
Macronutrient Comparison
Macronutrient breakdown side-by-side comparison
1
11%
88%
Protein:
1.44 g
Fats:
0.21 g
Carbs:
10.52 g
Water:
87.61 g
Other:
0.22 g
4
4%
20%
75%
Protein:
3.87 g
Fats:
0.65 g
Carbs:
19.86 g
Water:
74.93 g
Other:
0.69 g
Contains
more
Water Water
+16.9%
Contains
more
Protein Protein
+168.8%
Contains
more
Fats Fats
+209.5%
Contains
more
Carbs Carbs
+88.8%
Contains
more
Other Other
+213.6%