Potato vs. Russet potato — In-Depth Nutrition Comparison
Compare
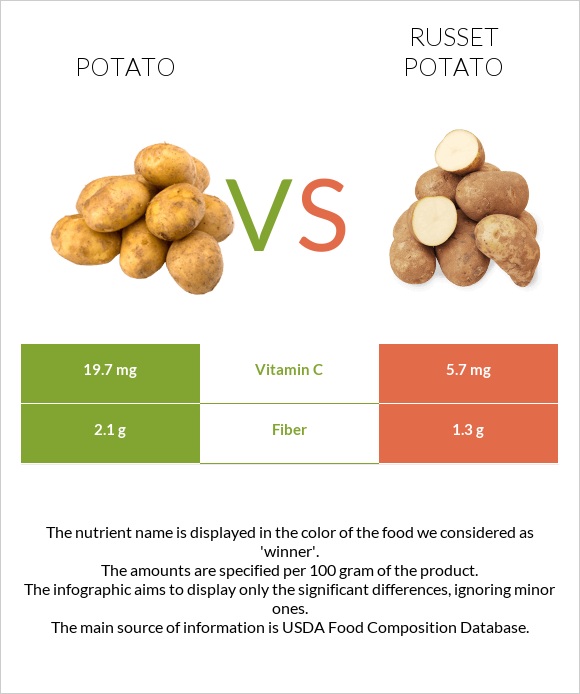
Significant differences between potatoes and russet potatoes
Specific food types used in this comparison are Potatoes, baked, flesh, and skin, without salt and Potatoes, Russet, flesh, and skin, baked.
Infographic
Infographic link
Mineral Comparison
Mineral comparison score is based on the number of minerals by which one or the other food is richer. The "coverage" charts below show how much of the daily needs can be covered by 300 grams of the food.
| Contains less SodiumSodium | -28.6% |
| Contains more CalciumCalcium | +20% |
| Contains more SeleniumSelenium | +25% |
Vitamin Comparison
Vitamin comparison score is based on the number of vitamins by which one or the other food is richer. The "coverage" charts below show how much of the daily needs can be covered by 300 grams of the food.
| Contains more Vitamin CVitamin C | +15.7% |
| Contains more Vitamin EVitamin E | +75% |
| Contains more Vitamin B6Vitamin B6 | +13.8% |
All nutrients comparison - raw data values
| Nutrient |  |
 |
DV% diff. |
| Vitamin B6 | 0.311mg | 0.354mg | 3% |
| Vitamin C | 9.6mg | 8.3mg | 1% |
| Copper | 0.118mg | 0.107mg | 1% |
| Folate | 28µg | 26µg | 1% |
| Calories | 93kcal | 97kcal | 0% |
| Protein | 2.5g | 2.63g | 0% |
| Protein per 100 calories | 2.7g | 2.7g | N/A |
| Calories per 10 g protein | 372kcal | 369kcal | N/A |
| Weight per 100 calories | 108g | 103g | N/A |
| Fats | 0.13g | 0.13g | 0% |
| Net carbs | 18.95g | 19.14g | N/A |
| Carbs | 21.15g | 21.44g | 0% |
| Magnesium | 28mg | 30mg | 0% |
| Calcium | 15mg | 18mg | 0% |
| Potassium | 535mg | 550mg | 0% |
| Iron | 1.08mg | 1.07mg | 0% |
| Sugar | 1.18g | 1.08g | N/A |
| Fiber | 2.2g | 2.3g | 0% |
| Zinc | 0.36mg | 0.35mg | 0% |
| Starch | 17.27g | 17.45g | 0% |
| Phosphorus | 70mg | 71mg | 0% |
| Sodium | 10mg | 14mg | 0% |
| Vitamin A | 1µg | 1µg | 0% |
| Vitamin E | 0.04mg | 0.07mg | 0% |
| Manganese | 0.219mg | 0.228mg | 0% |
| Selenium | 0.4µg | 0.5µg | 0% |
| Vitamin B1 | 0.064mg | 0.067mg | 0% |
| Vitamin B2 | 0.048mg | 0.048mg | 0% |
| Vitamin B3 | 1.41mg | 1.348mg | 0% |
| Vitamin B5 | 0.376mg | 0.38mg | 0% |
| Vitamin K | 2µg | 2µg | 0% |
| Choline | 14.8mg | 15mg | 0% |
| Saturated fat | 0.034g | 0.032g | 0% |
| Monounsaturated fat | 0.003g | 0.003g | 0% |
| Polyunsaturated fat | 0.057g | 0.054g | 0% |
| Tryptophan | 0.025mg | 0.027mg | 0% |
| Threonine | 0.081mg | 0.086mg | 0% |
| Isoleucine | 0.08mg | 0.085mg | 0% |
| Leucine | 0.119mg | 0.125mg | 0% |
| Lysine | 0.13mg | 0.137mg | 0% |
| Methionine | 0.038mg | 0.041mg | 0% |
| Phenylalanine | 0.099mg | 0.104mg | 0% |
| Valine | 0.125mg | 0.131mg | 0% |
| Histidine | 0.042mg | 0.044mg | 0% |
| Fructose | 0.34g | 0.32g | 0% |
Macronutrient Comparison
Macronutrient breakdown side-by-side comparison
Protein:
2.5 g
Fats:
0.13 g
Carbs:
21.15 g
Water:
74.89 g
Other:
1.33 g
Protein:
2.63 g
Fats:
0.13 g
Carbs:
21.44 g
Water:
74.45 g
Other:
1.35 g
~equal in
Protein
~2.63g
~equal in
Fats
~0.13g
~equal in
Carbs
~21.44g
~equal in
Water
~74.45g
~equal in
Other
~1.35g
Fat Type Comparison
Fat type breakdown side-by-side comparison
Saturated fat:
Sat. Fat
0.034 g
Monounsaturated fat:
Mono. Fat
0.003 g
Polyunsaturated fat:
Poly. Fat
0.057 g
Saturated fat:
Sat. Fat
0.032 g
Monounsaturated fat:
Mono. Fat
0.003 g
Polyunsaturated fat:
Poly. Fat
0.054 g
~equal in
Saturated fat
~0.032g
~equal in
Monounsaturated fat
~0.003g
~equal in
Polyunsaturated fat
~0.054g
Carbohydrate type comparison
Carbohydrate type breakdown side-by-side comparison
Starch:
17.27 g
Sucrose:
0.4 g
Glucose:
0.44 g
Fructose:
0.34 g
Lactose:
0 g
Maltose:
0 g
Galactose:
0 g
Starch:
17.45 g
Sucrose:
0.39 g
Glucose:
0.37 g
Fructose:
0.32 g
Lactose:
0 g
Maltose:
0 g
Galactose:
0 g
| Contains more GlucoseGlucose | +18.9% |
~equal in
Starch
~17.45g
~equal in
Sucrose
~0.39g
~equal in
Fructose
~0.32g
~equal in
Lactose
~0g
~equal in
Maltose
~0g
~equal in
Galactose
~0g


