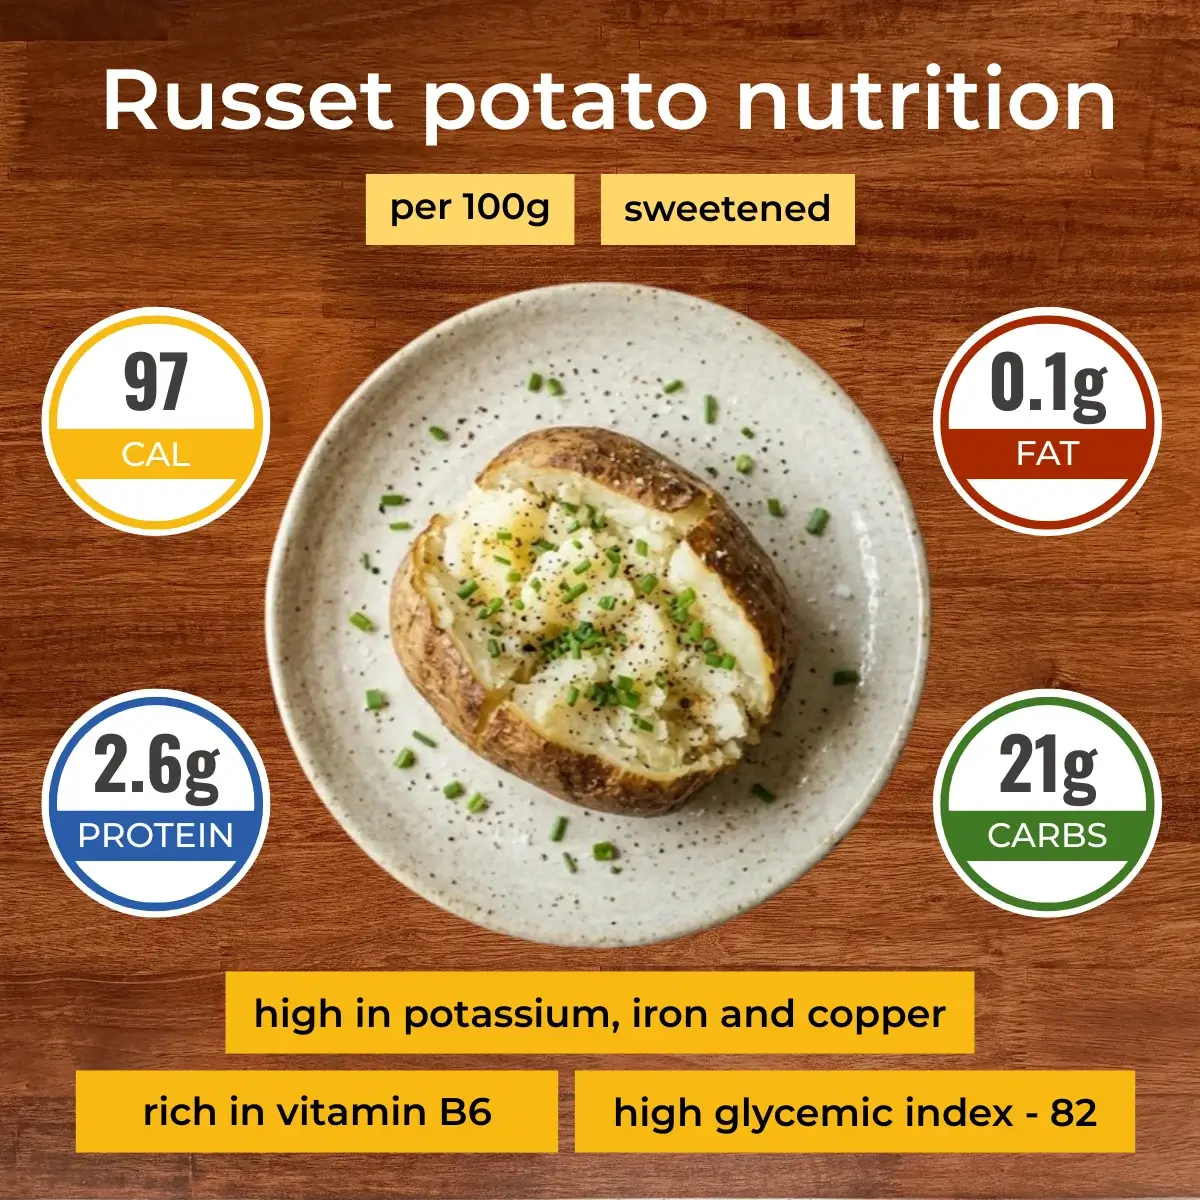
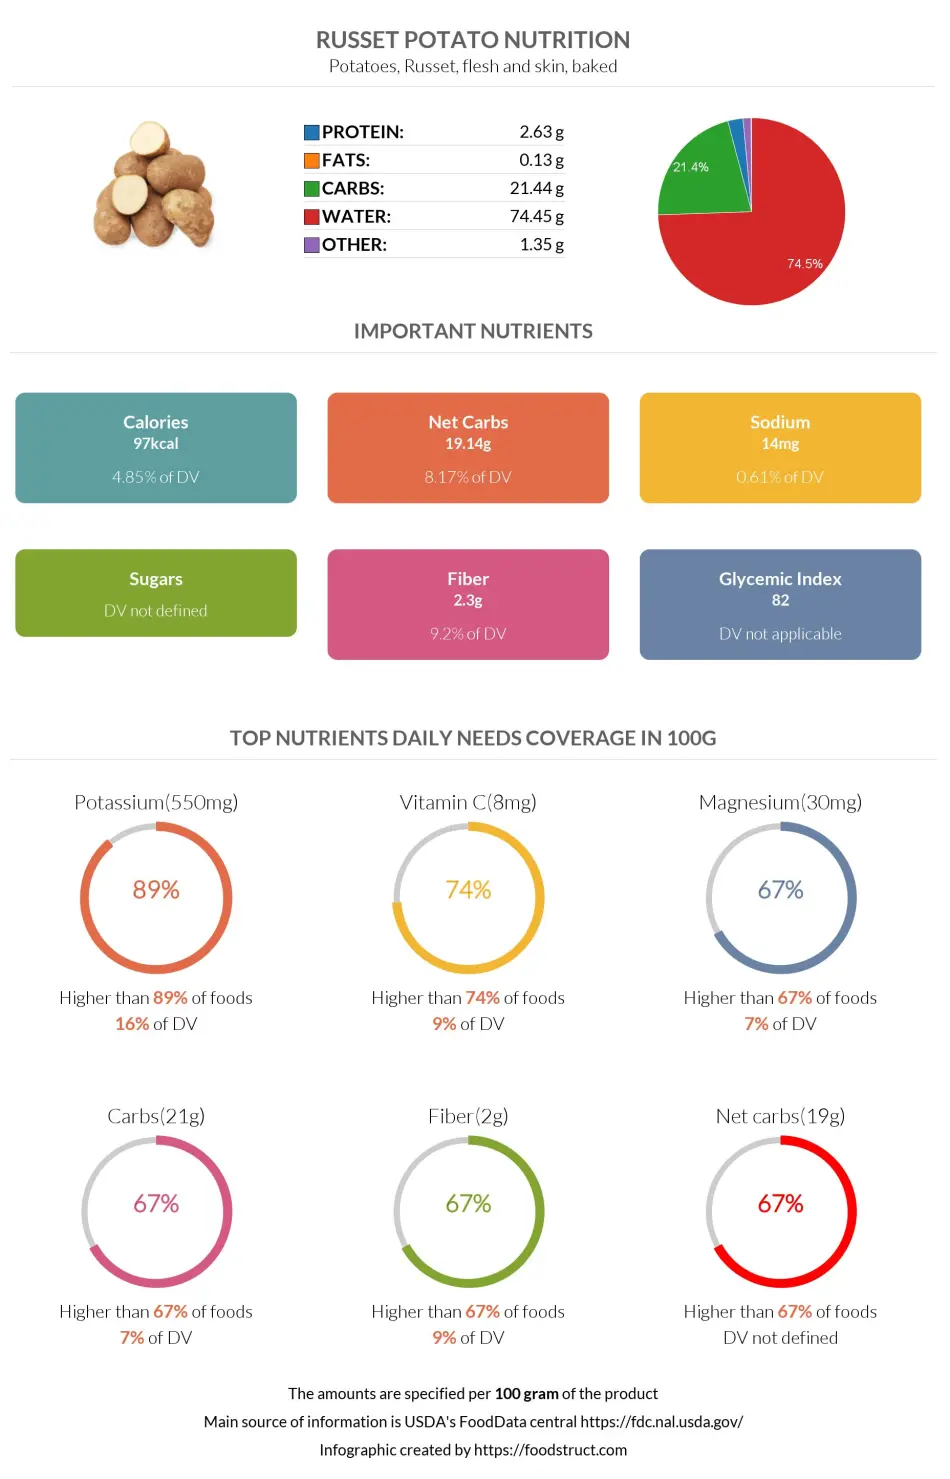
Russet potato nutrition: calories, carbs, GI, protein, fiber, fats
Potatoes, Russet, flesh and skin, baked
*all the values are displayed for the amount of 100 grams
Top nutrition facts for Russet potato
| Starch | 17.45 g |
| Calories ⓘ Calories for selected serving | 97 kcal |
|
Glycemic index ⓘ
Source: The GI of peeled, boiled Russet Burbank potato. https://www.sciencedirect.com/science/article/pii/S0002916522004944
Check out our Glycemic index chart page for the full list.
|
82 (high) |
| Insulin index ⓘ The insulin index of foods demonstrates how much a food increases the insulin level in the blood, in the first two-hour period after consumption. | 78 ⓘ https://www.researchgate.net/publication/260430587 - The insulin index for white potatoes. |
| Potassium | 550 mg |
| Net carbs ⓘ Net Carbs = Total Carbohydrates – Fiber – Sugar Alcohols | 19 g |
Russet potato calories (kcal)
| Calories for different serving sizes of russet potato | Calories | Weight |
|---|---|---|
| Calories in 100 grams | 97 |
| Calories for different varieties of russet potato | Calories | Weight |
|---|---|---|
| Potatoes, Russet, flesh and skin, baked (this food) | 97 | 100 g |
| Potatoes, white, flesh and skin, raw | 69 | 100 g |
| Russet potato raw | 79 | 100 g |
| Potatoes, yellow fleshed, hash brown, shredded, salt added in processing, frozen, unprepared | 81 | 100 g |
| Potatoes, scalloped, home-prepared with butter | 88 | 100 g |
| Potatoes, scalloped, home-prepared with margarine | 88 | 100 g |
| Potatoes, scalloped, dry mix, prepared with water, whole milk and butter | 93 | 100 g |
| Potatoes, white, flesh and skin, baked | 94 | 100 g |
| Potatoes, yellow fleshed, french fried, frozen, unprepared | 162 | 100 g |
| Potatoes, scalloped, dry mix, unprepared | 358 | 100 g |
Extra Nutrition facts for Russet potato
| Protein per 100 calories ⓘ Shows how many grams of protein you get from 100 calories of this food, calculated as (protein in g ÷ calories) × 100. | 2.7 g |
| Calories per 10 g protein ⓘ Shows how many calories you need to eat from this food to get 10 g of protein, calculated as (calories ÷ protein in g) × 10. | 369 kcal |
| Weight per 100 calories ⓘ Shows how many grams of this food equal 100 kcal—higher grams mean a larger portion for the same calories. | 103 g |
| Acidity (Based on PRAL) ⓘ PRAL (Potential renal acid load) is calculated using a formula. On the PRAL scale the higher the positive value, the more is the acidifying effect on the body. The lower the negative value, the higher the alkalinity of the food. 0 is neutral. | -8.6 (alkaline) |
| Chlorogenic acid | 76 mg ⓘ https://link.springer.com/article/10.1007/BF02854085 |
| Ferulic acid | 7 mcg ⓘ https://www.researchgate.net/publication/263423055 |
| Caffeic acid | 1.6 mcg ⓘ https://link.springer.com/article/10.1007/BF02854085 |
| Rutin | 13 mcg ⓘ https://www.researchgate.net/publication/263423055 |
| Gallic acid | 78 mg ⓘ https://www.researchgate.net/publication/263423055 |
| Total phenolic content | 520 mg GAE ⓘ https://www.researchgate.net/publication/263423055 |
| Resistant Starch ⓘ ChatGPT said: Resistant starch is a type of starch that isn’t digested in the small intestine and instead acts like fiber, feeding beneficial gut bacteria and improving insulin response. | 6 g ⓘ Hot boiled Russet potato has 6g of resistant starch, while baked and chilled Russet potato has 12g. https://www.researchgate.net/publication/336795613 |
| Processing score ⓘ The processing score is a calculated value that looks at both how industrially made it is (NOVA) and how healthy/unprocessed the ingredients are (SIGA), then combines them into one score from 1 (least processed) to 4 (most processed). | 1.7 - Minimally processed ⓘ (Cooked, fried) NOVA score = 2, SIGA score = A1 |
Russet potato Glycemic index (GI)
Source:
The GI of peeled, boiled Russet Burbank potato. https://www.sciencedirect.com/science/article/pii/S0002916522004944
Check out our Glycemic index chart page for the full list.
Mineral coverage chart
Mineral chart - relative view
Vitamin coverage chart
Vitamin A:
3µg of 900µg
0.33%
Vitamin E:
0.21mg of 15mg
1.4%
Vitamin D:
0µg of 20µg
0%
Vitamin C:
25mg of 90mg
28%
Vitamin B1:
0.2mg of 1mg
17%
Vitamin B2:
0.14mg of 1mg
11%
Vitamin B3:
4mg of 16mg
25%
Vitamin B5:
1.1mg of 5mg
23%
Vitamin B6:
1.1mg of 1mg
82%
Folate:
78µg of 400µg
20%
Vitamin B12:
0µg of 2µg
0%
Vitamin K:
6µg of 120µg
5%
Vitamin chart - relative view
Macronutrients chart
Protein:
Daily Value: 5%
2.6 g of 50 g
2.6 g (5% of DV )
Fats:
Daily Value: 0%
0.1 g of 65 g
0.1 g (0% of DV )
Carbs:
Daily Value: 7%
21.4 g of 300 g
21.4 g (7% of DV )
Water:
Daily Value: 4%
74.5 g of 2,000 g
74.5 g (4% of DV )
Other:
1.4 g
1.4 g
Protein quality breakdown
Tryptophan:
81mg of 280mg
29%
Threonine:
258mg of 1,050mg
25%
Isoleucine:
255mg of 1,400mg
18%
Leucine:
375mg of 2,730mg
14%
Lysine:
411mg of 2,100mg
20%
Methionine:
123mg of 1,050mg
12%
Phenylalanine:
312mg of 1,750mg
18%
Valine:
393mg of 1,820mg
22%
Histidine:
132mg of 700mg
19%
Fat type information
Saturated fat:
0.03 g
Monounsaturated fat:
0 g
Polyunsaturated fat:
0.05 g
Carbohydrate type breakdown
Starch:
17 g
Sucrose:
0.39 g
Glucose:
0.37 g
Fructose:
0.32 g
Lactose:
0 g
Maltose:
0 g
Galactose:
0 g
Fiber content ratio for Russet potato
Sugar:
1.1 g
Fiber:
2.3 g
Other:
18 g
All nutrients for Russet potato per 100g
| Nutrient | Value | DV% | In TOP % of foods | Comparison |
| Vitamin A | 1µg | 0% | 55% | |
| Calories | 97kcal | 5% | 74% |
2.1 times more than Orange
|
| Protein per 100 calories | 2.7g | N/A | 63% | |
| Protein | 2.6g | 6% | 74% |
1.1 times less than Broccoli
|
| Calories per 10 g protein | 369kcal | N/A | 34% | |
| Weight per 100 calories | 103g | N/A | 27% | |
| Fats | 0.13g | 0% | 91% |
256.2 times less than Cheese
|
| Vitamin C | 8.3mg | 9% | 17% |
6.4 times less than Lemon
|
| Net carbs | 19g | N/A | 33% |
2.8 times less than Chocolate
|
| Carbs | 21g | 7% | 34% |
1.3 times less than Rice
|
| Cholesterol | 0mg | 0% | 100% |
N/A
|
| Vitamin D* | 0 IU | 0% | 100% |
N/A
|
| Vitamin D | 0µg | 0% | 100% |
N/A
|
| Magnesium | 30mg | 7% | 25% |
4.7 times less than Almonds
|
| Calcium | 18mg | 2% | 54% |
6.9 times less than Milk
|
| Potassium | 550mg | 16% | 7% |
3.7 times more than Cucumber
|
| Iron | 1.1mg | 13% | 57% |
2.4 times less than Beef broiled
|
| Sugar | 1.1g | N/A | 45% |
8.3 times less than Coca-Cola
|
| Fiber | 2.3g | 9% | 27% |
Equal to Orange
|
| Copper | 0.11mg | 12% | 36% |
1.3 times less than Shiitake
|
| Zinc | 0.35mg | 3% | 69% |
18 times less than Beef broiled
|
| Starch | 17g | 7% | 6% |
1.1 times more than Potato
|
| Phosphorus | 71mg | 10% | 65% |
2.6 times less than Chicken meat
|
| Sodium | 14mg | 1% | 83% |
35 times less than White bread
|
| Vitamin E | 0.07mg | 0% | 57% |
20.9 times less than Kiwi
|
| Manganese | 0.23mg | 10% | 25% | |
| Selenium | 0.5µg | 1% | 70% | |
| Vitamin B1 | 0.07mg | 6% | 56% |
4 times less than Pea raw
|
| Vitamin B2 | 0.05mg | 4% | 75% |
2.7 times less than Avocado
|
| Vitamin B3 | 1.3mg | 8% | 58% |
7.1 times less than Turkey meat
|
| Vitamin B5 | 0.38mg | 8% | 42% |
3 times less than Sunflower seeds
|
| Vitamin B6 | 0.35mg | 27% | 26% |
3 times more than Oats
|
| Vitamin B12 | 0µg | 0% | 100% |
N/A
|
| Vitamin K | 2µg | 2% | 25% |
50.8 times less than Broccoli
|
| Trans fat | 0g | N/A | 100% |
N/A
|
| Folate | 26µg | 7% | 30% |
2.3 times less than Brussels sprouts
|
| Saturated fat | 0.03g | 0% | 85% |
184.2 times less than Beef broiled
|
| Choline | 15mg | 3% | 35% | |
| Monounsaturated fat | 0g | N/A | 88% |
3266.3 times less than Avocado
|
| Polyunsaturated fat | 0.05g | N/A | 82% |
873.6 times less than Walnut
|
| Tryptophan | 0.03mg | 0% | 49% |
11.3 times less than Chicken meat
|
| Threonine | 0.09mg | 0% | 50% |
8.4 times less than Beef broiled
|
| Isoleucine | 0.09mg | 0% | 50% |
10.8 times less than Salmon raw
|
| Leucine | 0.13mg | 0% | 51% |
19.4 times less than Tuna Bluefin
|
| Lysine | 0.14mg | 0% | 48% |
3.3 times less than Tofu
|
| Methionine | 0.04mg | 0% | 49% |
2.3 times less than Quinoa
|
| Phenylalanine | 0.1mg | 0% | 50% |
6.4 times less than Egg
|
| Valine | 0.13mg | 0% | 49% |
15.5 times less than Soybean raw
|
| Histidine | 0.04mg | 0% | 51% |
17 times less than Turkey meat
|
| Fructose | 0.32g | 0% | 10% |
18.4 times less than Apple
|
| Caffeine | 0mg | 0% | 100% | |
| Omega-3 - EPA | 0g | N/A | 100% |
N/A
|
| Omega-3 - DHA | 0g | N/A | 100% |
N/A
|
| Omega-3 - DPA | 0g | N/A | 100% |
N/A
|
Check out similar food or compare with current
NUTRITION FACTS LABEL
Nutrition Facts
___servings per container
Serving Size ______________
Serving Size ______________
Amount Per 100g
Calories 97
% Daily Value*
0.2%
Total Fat
0.13g
0.15%
Saturated Fat 0.03g
0
Trans Fat
0g
0
Cholesterol 0mg
0.61%
Sodium 14mg
7.1%
Total Carbohydrate
21g
9.2%
Dietary Fiber
2.3g
Total Sugars 0g
Includes ? g Added Sugars
Protein
2.6g
Vitamin D
0mcg
0
Calcium
18mg
1.8%
Iron
1.1mg
13%
Potassium
550mg
16%
*
The % Daily Value (DV) tells you how much a nutrient in a serving of food contributes to a daily diet. 2,000 calories a day is used for general nutrition advice.
Health checks
ⓘ
Dietary cholesterol is not associated with an increased risk of coronary heart disease in healthy individuals. However, dietary cholesterol is common in foods that are high in harmful saturated fats.
Source
Low in Cholesterol
ⓘ
Trans fat consumption increases the risk of cardiovascular disease and mortality by negatively affecting blood lipid levels.
Source
No Trans Fats
ⓘ
Saturated fat intake can raise total cholesterol and LDL (low-density lipoprotein) levels, leading to an increased risk of atherosclerosis. Dietary guidelines recommend limiting saturated fats to under 10% of calories a day.
Source
Low in Saturated Fats
ⓘ
While the consumption of moderate amounts of added sugars is not detrimental to health, an excessive intake can increase the risk of obesity, and therefore, diabetes.
Source
Low in Sugars
Russet potato nutrition infographic
Infographic link
References
All the values for which the sources are not specified explicitly are taken from FDA’s Food Central. The exact link to the food presented on this page can be found below.