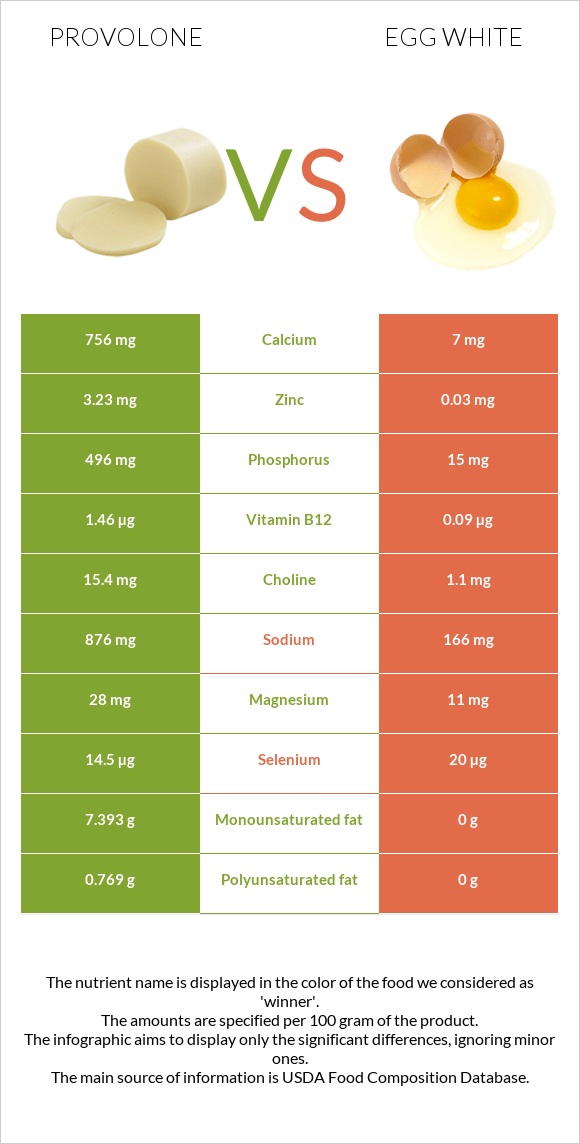
How are provolone and egg whites different? Provolone is higher in calcium, phosphorus, vitamin B12, zinc, and vitamin A; however, egg whites are richer in selenium and vitamin B2. Daily need coverage for saturated fat for provolone is 85% higher. Egg whites have less saturated fat. Egg whites have a lower glycemic index (0) than provolone (27). Cheese, provolone and Egg, white, raw, fresh are the varieties used in this article.
Infographic
Mineral Comparison
Mineral comparison score is based on the number of minerals by which one or the other food is richer. The "coverage" charts below show how much of the daily needs can be covered by 300 grams of the food.
6
100 g
300 g
1 cubic inch - 17g 1 slice (1 oz) - 28g 1 oz - 28.35g 1 cup, diced - 132g 1 package (6 oz) - 170g
Magnesium
Magnesium
Calcium
Calcium
Potassium
Potassium
Iron
Iron
Copper
Copper
Zinc
Zinc
Phosphorus
Phosphorus
Sodium
Sodium
Manganese
Manganese
Selenium
Selenium
20%
227%
12%
20%
8.7%
88%
213%
114%
1.3%
79%
3
100 g
300 g
1 large - 33g 1 cup - 243g
Magnesium
Magnesium
Calcium
Calcium
Potassium
Potassium
Iron
Iron
Copper
Copper
Zinc
Zinc
Phosphorus
Phosphorus
Sodium
Sodium
Manganese
Manganese
Selenium
Selenium
7.9%
2.1%
14%
3%
7.7%
0.82%
6.4%
22%
1.4%
109%
Vitamin Comparison
Vitamin comparison score is based on the number of vitamins by which one or the other food is richer. The "coverage" charts below show how much of the daily needs can be covered by 300 grams of the food.
10
100 g
300 g
1 cubic inch - 17g 1 slice (1 oz) - 28g 1 oz - 28.35g 1 cup, diced - 132g 1 package (6 oz) - 170g
Vitamin C
Vit. C
Vitamin D
Vit. D
Vitamin A
Vit. A
Vitamin E
Vit. E
Vitamin B1
Vit. B1
Vitamin B2
Vit. B2
Vitamin B3
Vit. B3
Vitamin B5
Vit. B5
Vitamin B6
Vit. B6
Vitamin B12
Vit. B12
Vitamin K
Vit. K
Folate
Folate
0%
7.5%
79%
4.6%
4.8%
74%
2.9%
29%
17%
183%
5.5%
7.5%
1
100 g
300 g
1 large - 33g 1 cup - 243g
Vitamin C
Vit. C
Vitamin D
Vit. D
Vitamin A
Vit. A
Vitamin E
Vit. E
Vitamin B1
Vit. B1
Vitamin B2
Vit. B2
Vitamin B3
Vit. B3
Vitamin B5
Vit. B5
Vitamin B6
Vit. B6
Vitamin B12
Vit. B12
Vitamin K
Vit. K
Folate
Folate
0%
0%
0%
0%
1%
101%
2%
11%
1.2%
11%
0%
3%
All nutrients comparison - raw data values
Nutrient
DV% diff.
Saturated fat
17.078g
0g
78%
Calcium
756mg
7mg
75%
Phosphorus
496mg
15mg
69%
Vitamin B12
1.46µg
0.09µg
57%
Fats
26.62g
0.17g
41%
Sodium
876mg
166mg
31%
Protein
25.58g
10.9g
29%
Zinc
3.23mg
0.03mg
29%
Vitamin A
236µg
0µg
26%
Cholesterol
69mg
0mg
23%
Monounsaturated fat
7.393g
0g
18%
Calories
351kcal
52kcal
15%
Selenium
14.5µg
20µg
10%
Vitamin B2
0.321mg
0.439mg
9%
Iron
0.52mg
0.08mg
6%
Vitamin B5
0.476mg
0.19mg
6%
Vitamin B6
0.073mg
0.005mg
5%
Polyunsaturated fat
0.769g
0g
5%
Magnesium
28mg
11mg
4%
Vitamin D*
20 IU
0 IU
3%
Vitamin D
0.5µg
0µg
3%
Choline
15.4mg
1.1mg
3%
Vitamin E
0.23mg
0mg
2%
Vitamin K
2.2µg
0µg
2%
Folate
10µg
4µg
2%
Potassium
138mg
163mg
1%
Vitamin B1
0.019mg
0.004mg
1%
Protein per 100 calories
7.3g
21g
N/A
Calories per 10 g protein
137kcal
48kcal
N/A
Weight per 100 calories
28g
192g
N/A
Unsaturated / Saturated Fat ratio
0.48
N/A
Net carbs
2.14g
0.73g
N/A
Carbs
2.14g
0.73g
0%
Sugar
0.56g
0.71g
N/A
Copper
0.026mg
0.023mg
0%
Manganese
0.01mg
0.011mg
0%
Vitamin B3
0.156mg
0.105mg
0%
Tryptophan
0.345mg
0.125mg
0%
Threonine
0.982mg
0.449mg
0%
Isoleucine
1.091mg
0.661mg
0%
Leucine
2.297mg
1.016mg
0%
Lysine
2.646mg
0.806mg
0%
Methionine
0.686mg
0.399mg
0%
Phenylalanine
1.287mg
0.686mg
0%
Valine
1.64mg
0.809mg
0%
Histidine
1.115mg
0.29mg
0%
Fructose
0.07g
0%
Macronutrient Comparison
Macronutrient breakdown side-by-side comparison
4
26%
27%
2%
41%
5%
Protein:
25.58 g
Fats:
26.62 g
Carbs:
2.14 g
Water:
40.95 g
Other:
4.71 g
1
11%
88%
Protein:
10.9 g
Fats:
0.17 g
Carbs:
0.73 g
Water:
87.57 g
Other:
0.63 g
Contains
more
Protein Protein
+134.7%
Contains
more
Fats Fats
+15558.8%
Contains
more
Carbs Carbs
+193.2%
Contains
more
Other Other
+647.6%
Contains
more
Water Water
+113.8%