Ravioli, cheese with tomato sauce, frozen, not prepared, includes regular and light entrees vs. Lasagne — In-Depth Nutrition Comparison
Compare
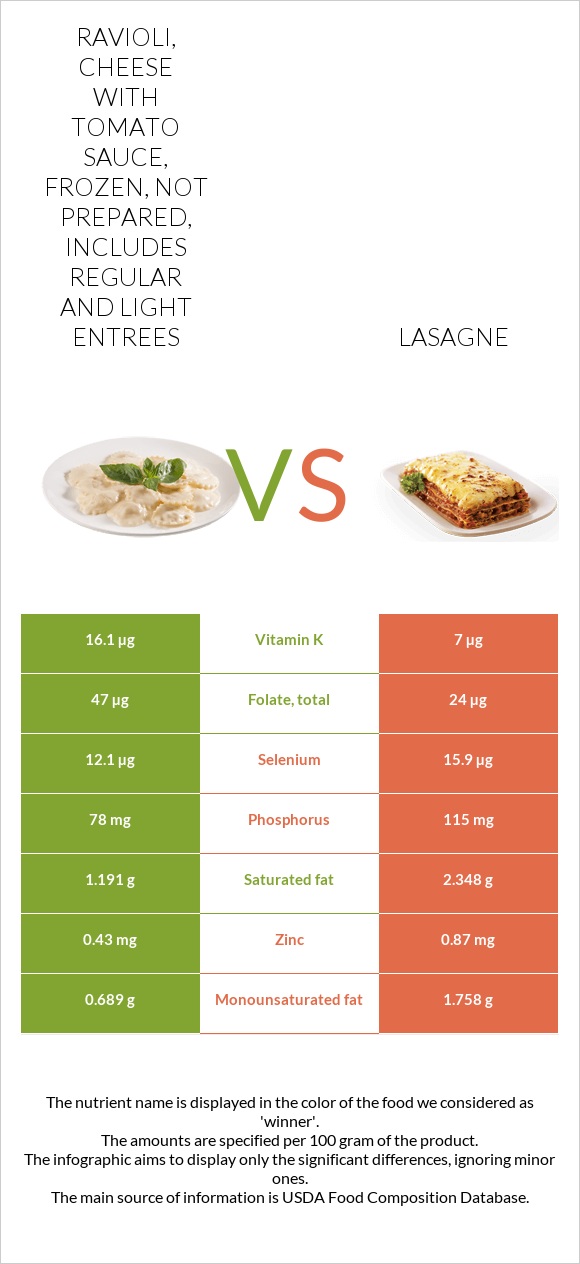
Summary of differences between ravioli, cheese with tomato sauce, frozen, not prepared, includes regular and light entrees and lasagne
- Ravioli, cheese with tomato sauce, frozen, not prepared, includes regular, and light entrees has more vitamin K and folate; however, lasagne is higher in vitamin B12, selenium, phosphorus, and monounsaturated fat.
- Ravioli, cheese with tomato sauce, frozen, not prepared, includes regular, and light entrees has 2 times more vitamin K than lasagne. While ravioli, cheese with tomato sauce, frozen, not prepared, includes regular, and light entrees has 16.1µg of vitamin K, lasagne has only 7µg.
- Ravioli, cheese with tomato sauce, frozen, not prepared, includes regular, and light entrees has less saturated fat.
These are the specific foods used in this comparison Ravioli, cheese with tomato sauce, frozen, not prepared, includes regular, and light entrees and Lasagna with meat sauce, frozen, prepared.
Infographic
Infographic link
Mineral Comparison
Mineral comparison score is based on the number of minerals by which one or the other food is richer. The "coverage" charts below show how much of the daily needs can be covered by 300 grams of the food.
| Contains more PotassiumPotassium | +18.9% |
| Contains more IronIron | +31% |
| Contains less SodiumSodium | -24.9% |
| Contains more CalciumCalcium | +11.4% |
| Contains more CopperCopper | +13.9% |
| Contains more ZincZinc | +102.3% |
| Contains more PhosphorusPhosphorus | +47.4% |
| Contains more SeleniumSelenium | +31.4% |
Vitamin Comparison
Vitamin comparison score is based on the number of vitamins by which one or the other food is richer. The "coverage" charts below show how much of the daily needs can be covered by 300 grams of the food.
| Contains more Vitamin CVitamin C | +12% |
| Contains more Vitamin DVitamin D | +∞% |
| Contains more Vitamin EVitamin E | +15.3% |
| Contains more Vitamin B1Vitamin B1 | +68.6% |
| Contains more Vitamin B2Vitamin B2 | +56.8% |
| Contains more Vitamin KVitamin K | +130% |
| Contains more FolateFolate | +95.8% |
| Contains more Vitamin AVitamin A | +17.1% |
| Contains more Vitamin B3Vitamin B3 | +20.6% |
| Contains more Vitamin B6Vitamin B6 | +13% |
| Contains more Vitamin B12Vitamin B12 | +135.7% |
All nutrients comparison - raw data values
| Nutrient |  |
 |
DV% diff. |
| Vitamin B12 | 0.14µg | 0.33µg | 8% |
| Vitamin K | 16.1µg | 7µg | 8% |
| Selenium | 12.1µg | 15.9µg | 7% |
| Protein | 4.52g | 7.28g | 6% |
| Vitamin B5 | 0.323mg | 6% | |
| Folate | 47µg | 24µg | 6% |
| Phosphorus | 78mg | 115mg | 5% |
| Saturated fat | 1.191g | 2.348g | 5% |
| Fats | 2.61g | 4.92g | 4% |
| Zinc | 0.43mg | 0.87mg | 4% |
| Sodium | 280mg | 373mg | 4% |
| Vitamin B1 | 0.118mg | 0.07mg | 4% |
| Iron | 0.93mg | 0.71mg | 3% |
| Vitamin B2 | 0.116mg | 0.074mg | 3% |
| Monounsaturated fat | 0.689g | 1.758g | 3% |
| Cholesterol | 11mg | 17mg | 2% |
| Vitamin B3 | 1.267mg | 1.528mg | 2% |
| Calories | 111kcal | 135kcal | 1% |
| Carbs | 17.31g | 15.36g | 1% |
| Vitamin D | 0.1µg | 0µg | 1% |
| Calcium | 79mg | 88mg | 1% |
| Potassium | 233mg | 196mg | 1% |
| Fiber | 1.4g | 1.7g | 1% |
| Copper | 0.079mg | 0.09mg | 1% |
| Vitamin A | 35µg | 41µg | 1% |
| Vitamin E | 0.98mg | 0.85mg | 1% |
| Vitamin B6 | 0.108mg | 0.122mg | 1% |
| Choline | 19.6mg | 23.2mg | 1% |
| Protein per 100 calories | 4.1g | 5.4g | N/A |
| Calories per 10 g protein | 246kcal | 185kcal | N/A |
| Weight per 100 calories | 90g | 74g | N/A |
| Unsaturated / Saturated Fat ratio | 0.93 | 0.93 | N/A |
| Vitamin C | 2.8mg | 2.5mg | 0% |
| Net carbs | 15.91g | 13.66g | N/A |
| Vitamin D* | 3 IU | 1 IU | 0% |
| Magnesium | 20mg | 20mg | 0% |
| Sugar | 4.09g | 3.11g | N/A |
| Starch | 10.1g | 9.83g | 0% |
| Manganese | 0.184mg | 0.193mg | 0% |
| Trans fat | 0.074g | 0.196g | N/A |
| Polyunsaturated fat | 0.42g | 0.433g | 0% |
| Tryptophan | 0.056mg | 0.085mg | 0% |
| Threonine | 0.154mg | 0.219mg | 0% |
| Isoleucine | 0.185mg | 0.224mg | 0% |
| Leucine | 0.349mg | 0.578mg | 0% |
| Lysine | 0.231mg | 0.486mg | 0% |
| Methionine | 0.077mg | 0.164mg | 0% |
| Phenylalanine | 0.2mg | 0.329mg | 0% |
| Valine | 0.226mg | 0.285mg | 0% |
| Histidine | 0.108mg | 0.183mg | 0% |
| Fructose | 1.08g | 1.04g | 0% |
| Omega-3 - EPA | 0.004g | 0.001g | N/A |
| Omega-3 - DHA | 0.001g | 0g | N/A |
| Omega-3 - ALA | 0.032g | 0.026g | N/A |
| Omega-3 - DPA | 0.002g | 0.003g | N/A |
| Omega-6 - Gamma-linoleic acid | 0.001g | 0g | N/A |
| Omega-6 - Dihomo-gamma-linoleic acid | 0.003g | 0.006g | N/A |
| Omega-6 - Eicosadienoic acid | 0.001g | 0.005g | N/A |
| Omega-6 - Linoleic acid | 0.338g | 0.322g | N/A |
Macronutrient Comparison
Macronutrient breakdown side-by-side comparison
Protein:
4.52 g
Fats:
2.61 g
Carbs:
17.31 g
Water:
74.33 g
Other:
1.23 g
Protein:
7.28 g
Fats:
4.92 g
Carbs:
15.36 g
Water:
70.87 g
Other:
1.57 g
| Contains more CarbsCarbs | +12.7% |
| Contains more ProteinProtein | +61.1% |
| Contains more FatsFats | +88.5% |
| Contains more OtherOther | +27.6% |
~equal in
Water
~70.87g
Fat Type Comparison
Fat type breakdown side-by-side comparison
Saturated fat:
Sat. Fat
1.191 g
Monounsaturated fat:
Mono. Fat
0.689 g
Polyunsaturated fat:
Poly. Fat
0.42 g
Saturated fat:
Sat. Fat
2.348 g
Monounsaturated fat:
Mono. Fat
1.758 g
Polyunsaturated fat:
Poly. Fat
0.433 g
| Contains less Sat. FatSaturated fat | -49.3% |
| Contains more Mono. FatMonounsaturated fat | +155.2% |
~equal in
Polyunsaturated fat
~0.433g
Carbohydrate type comparison
Carbohydrate type breakdown side-by-side comparison
Starch:
10.1 g
Sucrose:
0.51 g
Glucose:
1.1 g
Fructose:
1.08 g
Lactose:
1.1 g
Maltose:
0.29 g
Galactose:
0 g
Starch:
9.83 g
Sucrose:
0.54 g
Glucose:
0.93 g
Fructose:
1.04 g
Lactose:
0.6 g
Maltose:
0 g
Galactose:
0 g
| Contains more GlucoseGlucose | +18.3% |
| Contains more LactoseLactose | +83.3% |
| Contains more MaltoseMaltose | +∞% |
~equal in
Starch
~9.83g
~equal in
Sucrose
~0.54g
~equal in
Fructose
~1.04g
~equal in
Galactose
~0g