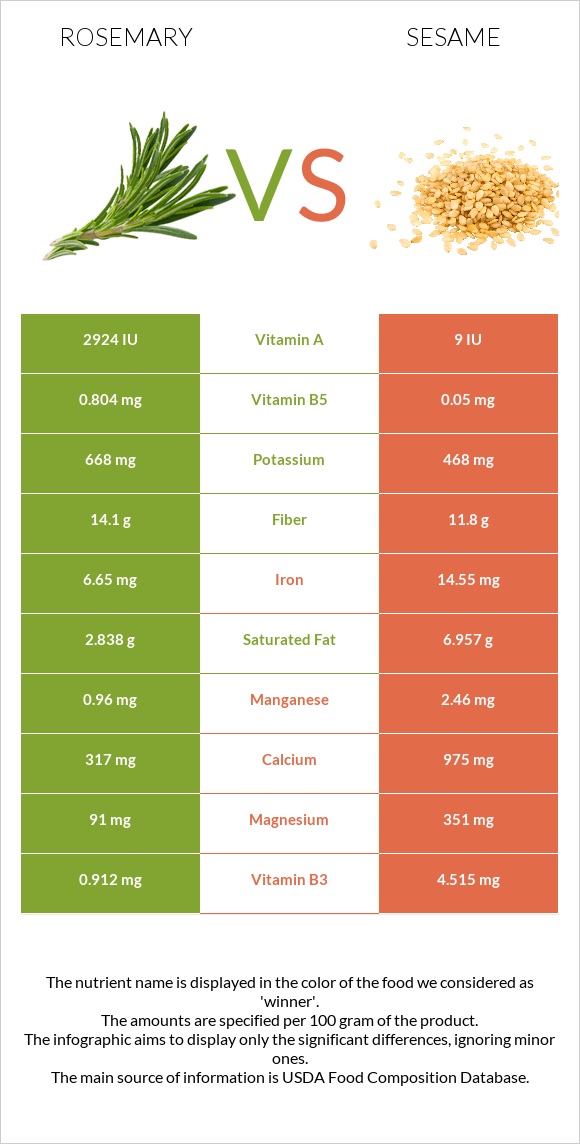
What are the main differences between rosemary and sesame? Rosemary is richer in vitamin A, yet sesame is richer in copper, iron, phosphorus, calcium, manganese, vitamin B1, zinc, magnesium, and vitamin B6. Sesame's daily need coverage for copper is 420% higher. Rosemary has 325 times more vitamin A than sesame. Rosemary has 2924 IU of vitamin A, while sesame has 9 IU. We used Rosemary, fresh and Seeds, sesame seeds, whole, dried types in this comparison.
Infographic
Mineral Comparison
Mineral comparison score is based on the number of minerals by which one or the other food is richer. The "coverage" charts below show how much of the daily needs can be covered by 300 grams of the food.
1
100 g
300 g
1 tsp - 0.7g 1 tbsp - 1.7g
Magnesium
Magnesium
Calcium
Calcium
Potassium
Potassium
Iron
Iron
Copper
Copper
Zinc
Zinc
Phosphorus
Phosphorus
Sodium
Sodium
Manganese
Manganese
Selenium
Selenium
65%
95%
59%
249%
100%
25%
28%
3.4%
125%
0%
9
100 g
300 g
1 tbsp - 9g 1 cup - 144g
Magnesium
Magnesium
Calcium
Calcium
Potassium
Potassium
Iron
Iron
Copper
Copper
Zinc
Zinc
Phosphorus
Phosphorus
Sodium
Sodium
Manganese
Manganese
Selenium
Selenium
251%
293%
41%
546%
1361%
211%
270%
1.4%
321%
188%
Vitamin Comparison
Vitamin comparison score is based on the number of vitamins by which one or the other food is richer. The "coverage" charts below show how much of the daily needs can be covered by 300 grams of the food.
4
100 g
300 g
1 tsp - 0.7g 1 tbsp - 1.7g
Vitamin C
Vit. C
Vitamin D
Vit. D
Vitamin A
Vit. A
Vitamin E
Vit. E
Vitamin B1
Vit. B1
Vitamin B2
Vit. B2
Vitamin B3
Vit. B3
Vitamin B5
Vit. B5
Vitamin B6
Vit. B6
Vitamin B12
Vit. B12
Vitamin K
Vit. K
Folate
Folate
73%
0%
49%
0%
9%
35%
17%
48%
78%
0%
0%
82%
5
100 g
300 g
1 tbsp - 9g 1 cup - 144g
Vitamin C
Vit. C
Vitamin D
Vit. D
Vitamin A
Vit. A
Vitamin E
Vit. E
Vitamin B1
Vit. B1
Vitamin B2
Vit. B2
Vitamin B3
Vit. B3
Vitamin B5
Vit. B5
Vitamin B6
Vit. B6
Vitamin B12
Vit. B12
Vitamin K
Vit. K
Folate
Folate
0%
0%
0%
5%
198%
57%
85%
3%
182%
0%
0%
73%
All nutrients comparison - raw data values
Nutrient
DV% diff.
Copper
0.301mg
4.082mg
420%
Polyunsaturated fat
0.901g
21.773g
139%
Iron
6.65mg
14.55mg
99%
Phosphorus
66mg
629mg
80%
Fats
5.86g
49.67g
67%
Calcium
317mg
975mg
66%
Manganese
0.96mg
2.46mg
65%
Selenium
34.4µg
63%
Vitamin B1
0.036mg
0.791mg
63%
Magnesium
91mg
351mg
62%
Zinc
0.93mg
7.75mg
62%
Monounsaturated fat
1.16g
18.759g
44%
Vitamin B6
0.336mg
0.79mg
35%
Protein
3.31g
17.73g
29%
Vitamin C
21.8mg
0mg
24%
Vitamin B3
0.912mg
4.515mg
23%
Calories
131kcal
573kcal
22%
Saturated fat
2.838g
6.957g
19%
Vitamin A
146µg
0µg
16%
Vitamin B5
0.804mg
0.05mg
15%
Fiber
14.1g
11.8g
9%
Vitamin B2
0.152mg
0.247mg
7%
Potassium
668mg
468mg
6%
Choline
25.6mg
5%
Folate
109µg
97µg
3%
Vitamin E
0.25mg
2%
Carbs
20.7g
23.45g
1%
Sodium
26mg
11mg
1%
Protein per 100 calories
2.5g
3.1g
N/A
Calories per 10 g protein
396kcal
323kcal
N/A
Weight per 100 calories
76g
17g
N/A
Unsaturated / Saturated Fat ratio
0.73
5.8
N/A
Net carbs
6.6g
11.65g
N/A
Sugar
0.3g
N/A
Tryptophan
0.051mg
0.388mg
0%
Threonine
0.136mg
0.736mg
0%
Isoleucine
0.136mg
0.763mg
0%
Leucine
0.249mg
1.358mg
0%
Lysine
0.143mg
0.569mg
0%
Methionine
0.047mg
0.586mg
0%
Phenylalanine
0.169mg
0.94mg
0%
Valine
0.165mg
0.99mg
0%
Histidine
0.066mg
0.522mg
0%
Macronutrient Comparison
Macronutrient breakdown side-by-side comparison
1
3%
6%
21%
68%
2%
Protein:
3.31 g
Fats:
5.86 g
Carbs:
20.7 g
Water:
67.77 g
Other:
2.36 g
4
18%
50%
23%
5%
4%
Protein:
17.73 g
Fats:
49.67 g
Carbs:
23.45 g
Water:
4.69 g
Other:
4.46 g
Contains
more
Water Water
+1345%
Contains
more
Protein Protein
+435.6%
Contains
more
Fats Fats
+747.6%
Contains
more
Carbs Carbs
+13.3%
Contains
more
Other Other
+89%
Fat Type Comparison
Fat type breakdown side-by-side comparison
1
58%
24%
18%
Saturated fat:
Sat. Fat
2.838 g
Monounsaturated fat:
Mono. Fat
1.16 g
Polyunsaturated fat:
Poly. Fat
0.901 g
2
15%
40%
46%
Saturated fat:
Sat. Fat
6.957 g
Monounsaturated fat:
Mono. Fat
18.759 g
Polyunsaturated fat:
Poly. Fat
21.773 g
Contains
less
Sat. Fat Saturated fat
-59.2%
Contains
more
Mono. Fat Monounsaturated fat
+1517.2%
Contains
more
Poly. Fat Polyunsaturated fat
+2316.5%