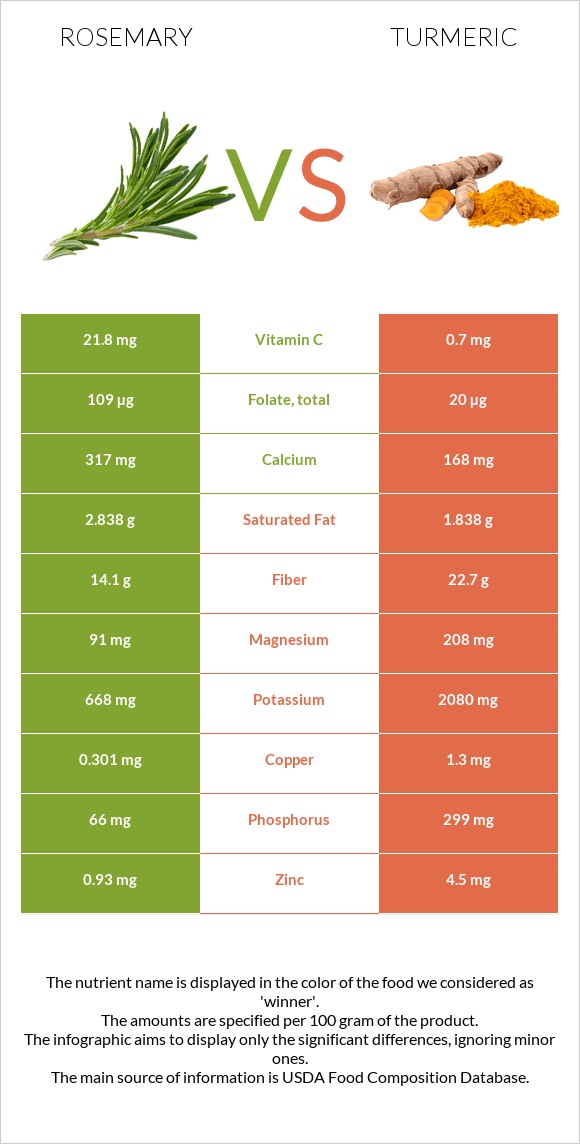
What are the main differences between rosemary and turmeric? Rosemary is richer in vitamin A and vitamin C, yet turmeric is richer in manganese, iron, copper, potassium, fiber, phosphorus, zinc, and magnesium. Turmeric's daily need coverage for manganese is 819% higher. Turmeric has a lower glycemic index than rosemary. We used Rosemary, fresh and Spices, turmeric, ground types in this comparison.
Infographic
Mineral Comparison
Mineral comparison score is based on the number of minerals by which one or the other food is richer. The "coverage" charts below show how much of the daily needs can be covered by 300 grams of the food.
1
100 g
300 g
1 tsp - 0.7g 1 tbsp - 1.7g
Magnesium
Magnesium
Calcium
Calcium
Potassium
Potassium
Iron
Iron
Copper
Copper
Zinc
Zinc
Phosphorus
Phosphorus
Sodium
Sodium
Manganese
Manganese
Selenium
Selenium
65%
95%
59%
249%
100%
25%
28%
3.4%
125%
0%
8
100 g
300 g
0.25 tsp - 0.5g 1 tbsp - 9.4g
Magnesium
Magnesium
Calcium
Calcium
Potassium
Potassium
Iron
Iron
Copper
Copper
Zinc
Zinc
Phosphorus
Phosphorus
Sodium
Sodium
Manganese
Manganese
Selenium
Selenium
149%
50%
184%
2063%
433%
123%
128%
3.5%
2583%
34%
Vitamin Comparison
Vitamin comparison score is based on the number of vitamins by which one or the other food is richer. The "coverage" charts below show how much of the daily needs can be covered by 300 grams of the food.
5
100 g
300 g
1 tsp - 0.7g 1 tbsp - 1.7g
Vitamin C
Vit. C
Vitamin D
Vit. D
Vitamin A
Vit. A
Vitamin E
Vit. E
Vitamin B1
Vit. B1
Vitamin B2
Vit. B2
Vitamin B3
Vit. B3
Vitamin B5
Vit. B5
Vitamin B6
Vit. B6
Vitamin B12
Vit. B12
Vitamin K
Vit. K
Folate
Folate
73%
0%
49%
0%
9%
35%
17%
48%
78%
0%
0%
82%
4
100 g
300 g
0.25 tsp - 0.5g 1 tbsp - 9.4g
Vitamin C
Vit. C
Vitamin D
Vit. D
Vitamin A
Vit. A
Vitamin E
Vit. E
Vitamin B1
Vit. B1
Vitamin B2
Vit. B2
Vitamin B3
Vit. B3
Vitamin B5
Vit. B5
Vitamin B6
Vit. B6
Vitamin B12
Vit. B12
Vitamin K
Vit. K
Folate
Folate
2.3%
0%
0%
89%
15%
35%
25%
33%
25%
0%
34%
15%
All nutrients comparison - raw data values
Nutrient
DV% diff.
Manganese
0.96mg
19.8mg
819%
Iron
6.65mg
55mg
604%
Copper
0.301mg
1.3mg
111%
Potassium
668mg
2080mg
42%
Fiber
14.1g
22.7g
34%
Phosphorus
66mg
299mg
33%
Zinc
0.93mg
4.5mg
32%
Vitamin E
4.43mg
30%
Magnesium
91mg
208mg
28%
Vitamin C
21.8mg
0.7mg
23%
Folate
109µg
20µg
22%
Vitamin B6
0.336mg
0.107mg
18%
Vitamin A
146µg
0µg
16%
Carbs
20.7g
67.14g
15%
Calcium
317mg
168mg
15%
Protein
3.31g
9.68g
13%
Selenium
6.2µg
11%
Vitamin K
13.4µg
11%
Calories
131kcal
312kcal
9%
Choline
49.2mg
9%
Vitamin B5
0.804mg
0.542mg
5%
Saturated fat
2.838g
1.838g
5%
Fats
5.86g
3.25g
4%
Vitamin B3
0.912mg
1.35mg
3%
Vitamin B1
0.036mg
0.058mg
2%
Monounsaturated fat
1.16g
0.449g
2%
Polyunsaturated fat
0.901g
0.756g
1%
Fructose
0.45g
1%
Protein per 100 calories
2.5g
3.1g
N/A
Calories per 10 g protein
396kcal
322kcal
N/A
Weight per 100 calories
76g
32g
N/A
Unsaturated / Saturated Fat ratio
0.73
0.66
N/A
Net carbs
6.6g
44.44g
N/A
Sugar
3.21g
N/A
Sodium
26mg
27mg
0%
Vitamin B2
0.152mg
0.15mg
0%
Trans fat
0g
0.056g
N/A
Tryptophan
0.051mg
0.17mg
0%
Threonine
0.136mg
0.33mg
0%
Isoleucine
0.136mg
0.47mg
0%
Leucine
0.249mg
0.81mg
0%
Lysine
0.143mg
0.38mg
0%
Methionine
0.047mg
0.14mg
0%
Phenylalanine
0.169mg
0.53mg
0%
Valine
0.165mg
0.66mg
0%
Histidine
0.066mg
0.15mg
0%
Omega-3 - ALA
0.003g
N/A
Omega-6 - Gamma-linoleic acid
0.081g
N/A
Macronutrient Comparison
Macronutrient breakdown side-by-side comparison
2
3%
6%
21%
68%
2%
Protein:
3.31 g
Fats:
5.86 g
Carbs:
20.7 g
Water:
67.77 g
Other:
2.36 g
3
10%
3%
67%
13%
7%
Protein:
9.68 g
Fats:
3.25 g
Carbs:
67.14 g
Water:
12.85 g
Other:
7.08 g
Contains
more
Fats Fats
+80.3%
Contains
more
Water Water
+427.4%
Contains
more
Protein Protein
+192.4%
Contains
more
Carbs Carbs
+224.3%
Contains
more
Other Other
+200%
Fat Type Comparison
Fat type breakdown side-by-side comparison
2
58%
24%
18%
Saturated fat:
Sat. Fat
2.838 g
Monounsaturated fat:
Mono. Fat
1.16 g
Polyunsaturated fat:
Poly. Fat
0.901 g
1
60%
15%
25%
Saturated fat:
Sat. Fat
1.838 g
Monounsaturated fat:
Mono. Fat
0.449 g
Polyunsaturated fat:
Poly. Fat
0.756 g
Contains
more
Mono. Fat Monounsaturated fat
+158.4%
Contains
more
Poly. Fat Polyunsaturated fat
+19.2%
Contains
less
Sat. Fat Saturated fat
-35.2%