Safflower oil vs. Benecol — In-Depth Nutrition Comparison
Compare
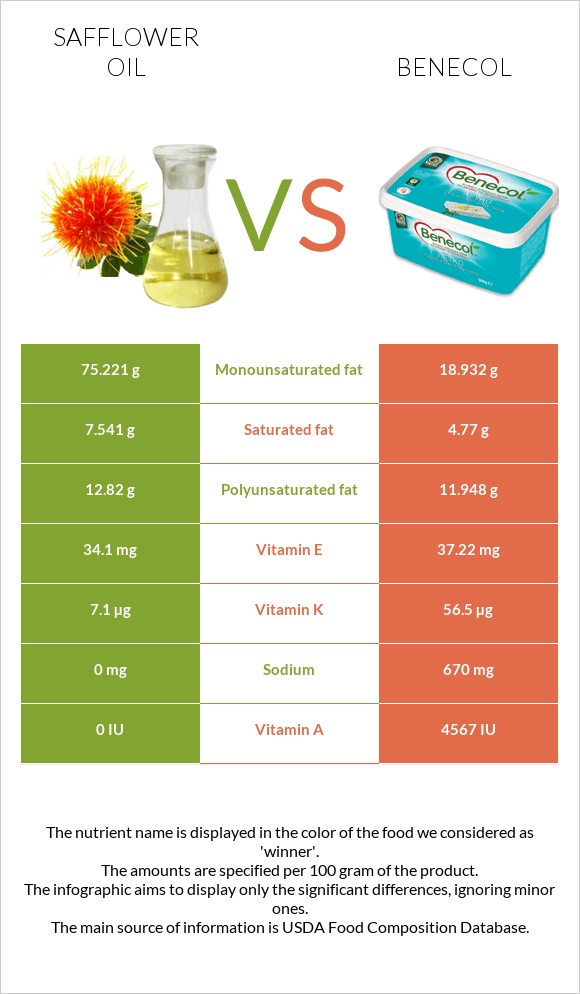
How are safflower oil and benecol different?
- Safflower oil is richer in monounsaturated fat and polyunsaturated fat, while benecol is higher in vitamin A, vitamin K, and vitamin E.
- Benecol covers your daily need for vitamin A, 91% more than safflower oil.
- Safflower oil contains 4 times more monounsaturated fat than benecol. Safflower oil contains 75.221g of monounsaturated fat, while benecol contains 18.932g.
- Benecol is lower in saturated fat.
Oil, safflower, salad or cooking, high oleic (primary safflower oil of commerce) and Margarine-like spread, BENECOL Light Spread types were used in this article.
Infographic
Infographic link
Mineral Comparison
Mineral comparison score is based on the number of minerals by which one or the other food is richer. The "coverage" charts below show how much of the daily needs can be covered by 300 grams of the food.
| Contains less SodiumSodium | -100% |
| Contains more MagnesiumMagnesium | +∞% |
| Contains more CalciumCalcium | +∞% |
| Contains more PotassiumPotassium | +∞% |
| Contains more PhosphorusPhosphorus | +∞% |
Vitamin Comparison
Vitamin comparison score is based on the number of vitamins by which one or the other food is richer. The "coverage" charts below show how much of the daily needs can be covered by 300 grams of the food.
| Contains more Vitamin AVitamin A | +∞% |
| Contains more Vitamin B1Vitamin B1 | +∞% |
| Contains more Vitamin KVitamin K | +695.8% |
All nutrients comparison - raw data values
| Nutrient |  |
 |
DV% diff. |
| Vitamin A | 0µg | 1370µg | 152% |
| Monounsaturated fat | 75.221g | 18.932g | 141% |
| Fats | 100g | 38.71g | 94% |
| Vitamin K | 7.1µg | 56.5µg | 41% |
| Sodium | 0mg | 670mg | 29% |
| Calories | 884kcal | 357kcal | 26% |
| Vitamin E | 34.1mg | 37.22mg | 21% |
| Saturated fat | 7.541g | 4.77g | 13% |
| Polyunsaturated fat | 12.82g | 11.948g | 6% |
| Carbs | 0g | 5.71g | 2% |
| Phosphorus | 0mg | 4mg | 1% |
| Vitamin B1 | 0mg | 0.012mg | 1% |
| Weight per 100 calories | 11g | 28g | N/A |
| Unsaturated / Saturated Fat ratio | 12 | 6.5 | N/A |
| Net carbs | 0g | 5.71g | N/A |
| Magnesium | 0mg | 1mg | 0% |
| Calcium | 0mg | 4mg | 0% |
| Potassium | 0mg | 4mg | 0% |
| Trans fat | 0.096g | 2.214g | N/A |
| Choline | 0.2mg | 0% | |
| Omega-3 - ALA | 0.096g | 1.976g | N/A |
| Omega-6 - Eicosadienoic acid | 0.037g | N/A | |
| Omega-6 - Linoleic acid | 12.724g | 9.557g | N/A |
Macronutrient Comparison
Macronutrient breakdown side-by-side comparison
Protein:
0 g
Fats:
100 g
Carbs:
0 g
Water:
0 g
Other:
0 g
Protein:
0 g
Fats:
38.71 g
Carbs:
5.71 g
Water:
53.73 g
Other:
1.85 g
| Contains more FatsFats | +158.3% |
| Contains more CarbsCarbs | +∞% |
| Contains more WaterWater | +∞% |
| Contains more OtherOther | +∞% |
~equal in
Protein
~0g
Fat Type Comparison
Fat type breakdown side-by-side comparison
Saturated fat:
Sat. Fat
7.541 g
Monounsaturated fat:
Mono. Fat
75.221 g
Polyunsaturated fat:
Poly. Fat
12.82 g
Saturated fat:
Sat. Fat
4.77 g
Monounsaturated fat:
Mono. Fat
18.932 g
Polyunsaturated fat:
Poly. Fat
11.948 g
| Contains more Mono. FatMonounsaturated fat | +297.3% |
| Contains less Sat. FatSaturated fat | -36.7% |
~equal in
Polyunsaturated fat
~11.948g


