Safflower oil vs. Olive oil — In-Depth Nutrition Comparison
Compare
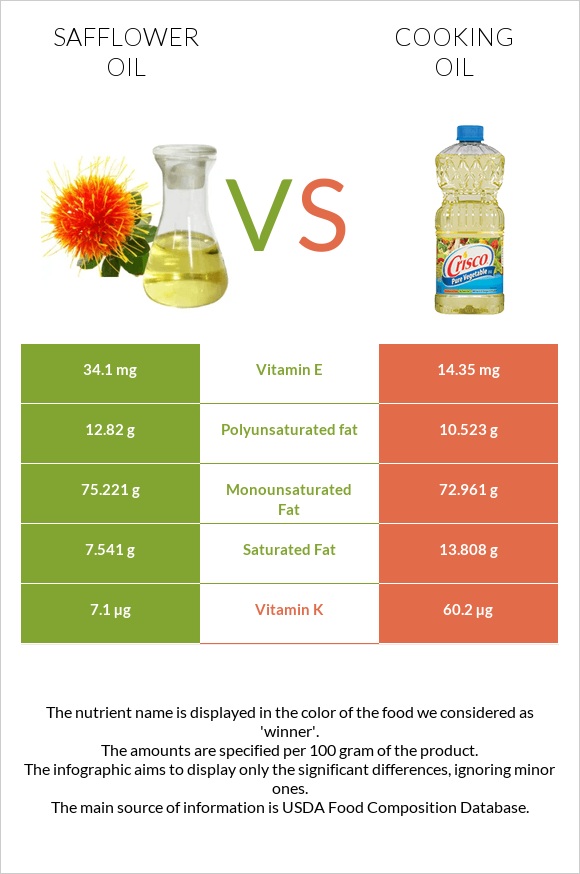
The main differences between safflower oil and olive oil
- Safflower oil has more vitamin E, monounsaturated fat, and polyunsaturated fat; however, olive oil has more vitamin K and iron.
- Daily need coverage for vitamin E for safflower oil is 132% higher.
- Safflower oil is lower in saturated fat.
Food types used in this article are Oil, safflower, salad or cooking, high oleic (primary safflower oil of commerce) and Oil, olive, salad or cooking.
Infographic
Infographic link
Mineral Comparison
Mineral comparison score is based on the number of minerals by which one or the other food is richer. The "coverage" charts below show how much of the daily needs can be covered by 300 grams of the food.
| Contains less SodiumSodium | -100% |
| Contains more CalciumCalcium | +∞% |
| Contains more PotassiumPotassium | +∞% |
| Contains more IronIron | +∞% |
Vitamin Comparison
Vitamin comparison score is based on the number of vitamins by which one or the other food is richer. The "coverage" charts below show how much of the daily needs can be covered by 300 grams of the food.
| Contains more Vitamin EVitamin E | +137.6% |
| Contains more Vitamin KVitamin K | +747.9% |
All nutrients comparison - raw data values
| Nutrient |  |
 |
DV% diff. |
| Vitamin E | 34.1mg | 14.35mg | 132% |
| Vitamin K | 7.1µg | 60.2µg | 44% |
| Saturated fat | 7.541g | 13.808g | 28% |
| Polyunsaturated fat | 12.82g | 10.523g | 15% |
| Iron | 0mg | 0.56mg | 7% |
| Monounsaturated fat | 75.221g | 72.961g | 6% |
| Calories | 884kcal | 884kcal | 0% |
| Weight per 100 calories | 11g | 11g | N/A |
| Fats | 100g | 100g | 0% |
| Unsaturated / Saturated Fat ratio | 12 | 6 | N/A |
| Calcium | 0mg | 1mg | 0% |
| Potassium | 0mg | 1mg | 0% |
| Sodium | 0mg | 2mg | 0% |
| Trans fat | 0.096g | N/A | |
| Choline | 0.2mg | 0.3mg | 0% |
| Omega-3 - ALA | 0.096g | N/A | |
| Omega-6 - Linoleic acid | 12.724g | N/A |
Macronutrient Comparison
Macronutrient breakdown side-by-side comparison
Protein:
0 g
Fats:
100 g
Carbs:
0 g
Water:
0 g
Other:
0 g
Protein:
0 g
Fats:
100 g
Carbs:
0 g
Water:
0 g
Other:
0 g
~equal in
Protein
~0g
~equal in
Fats
~100g
~equal in
Carbs
~0g
~equal in
Water
~0g
~equal in
Other
~0g
Fat Type Comparison
Fat type breakdown side-by-side comparison
Saturated fat:
Sat. Fat
7.541 g
Monounsaturated fat:
Mono. Fat
75.221 g
Polyunsaturated fat:
Poly. Fat
12.82 g
Saturated fat:
Sat. Fat
13.808 g
Monounsaturated fat:
Mono. Fat
72.961 g
Polyunsaturated fat:
Poly. Fat
10.523 g
| Contains less Sat. FatSaturated fat | -45.4% |
| Contains more Poly. FatPolyunsaturated fat | +21.8% |
~equal in
Monounsaturated fat
~72.961g


