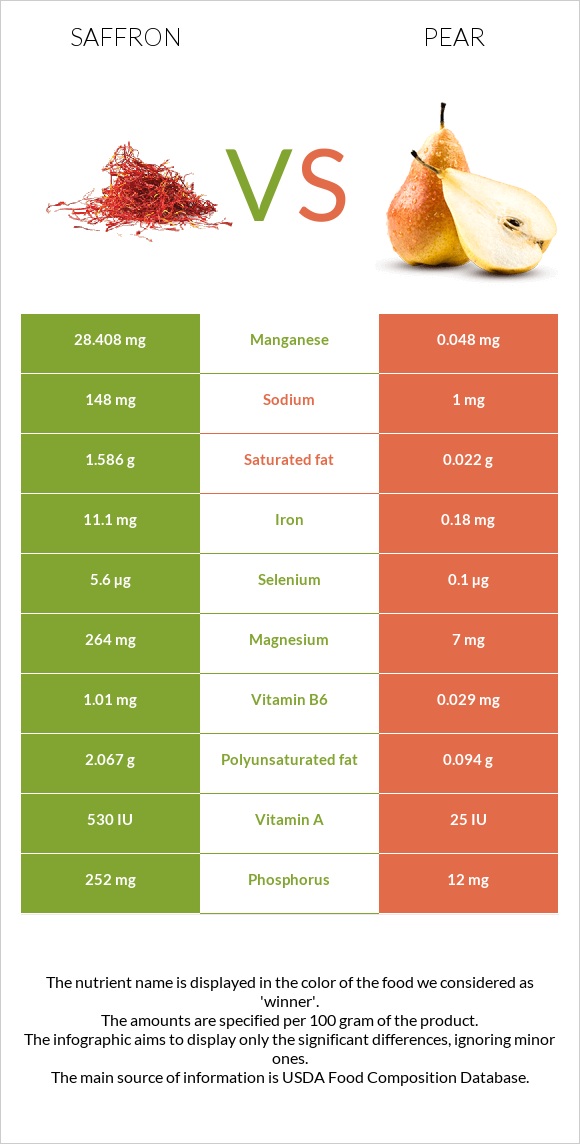
How are saffron and pear different? Saffron has more manganese, iron, vitamin C, vitamin B6, magnesium, potassium, phosphorus, copper, folate, and vitamin B2 than pear. Daily need coverage for manganese for saffron is 1233% higher. Saffron contains 62 times more iron than pear. While saffron contains 11.1mg of iron, pear contains only 0.18mg. Pear has a lower glycemic index (38) than saffron (70). Spices, saffron and Pears, raw are the varieties used in this article.
Infographic
Mineral Comparison
Mineral comparison score is based on the number of minerals by which one or the other food is richer. The "coverage" charts below show how much of the daily needs can be covered by 300 grams of the food.
9
100 g
300 g
0.25 tsp - 0.5g 1 tbsp - 2.1g
Magnesium
Magnesium
Calcium
Calcium
Potassium
Potassium
Iron
Iron
Copper
Copper
Zinc
Zinc
Phosphorus
Phosphorus
Sodium
Sodium
Manganese
Manganese
Selenium
Selenium
189%
33%
152%
416%
109%
30%
108%
19%
3705%
31%
1
100 g
300 g
1 cup, slices - 140g 1 small - 148g 1 cup, cubes - 161g 1 NLEA serving - 166g 1 medium - 178g 1 large - 230g
Magnesium
Magnesium
Calcium
Calcium
Potassium
Potassium
Iron
Iron
Copper
Copper
Zinc
Zinc
Phosphorus
Phosphorus
Sodium
Sodium
Manganese
Manganese
Selenium
Selenium
5%
2.7%
10%
6.8%
27%
2.7%
5.1%
0.13%
6.3%
0.55%
Vitamin Comparison
Vitamin comparison score is based on the number of vitamins by which one or the other food is richer. The "coverage" charts below show how much of the daily needs can be covered by 300 grams of the food.
7
100 g
300 g
0.25 tsp - 0.5g 1 tbsp - 2.1g
Vitamin C
Vit. C
Vitamin D
Vit. D
Vitamin A
Vit. A
Vitamin E
Vit. E
Vitamin B1
Vit. B1
Vitamin B2
Vit. B2
Vitamin B3
Vit. B3
Vitamin B5
Vit. B5
Vitamin B6
Vit. B6
Vitamin B12
Vit. B12
Vitamin K
Vit. K
Folate
Folate
269%
0%
9%
0%
29%
62%
27%
0%
233%
0%
0%
70%
3
100 g
300 g
1 cup, slices - 140g 1 small - 148g 1 cup, cubes - 161g 1 NLEA serving - 166g 1 medium - 178g 1 large - 230g
Vitamin C
Vit. C
Vitamin D
Vit. D
Vitamin A
Vit. A
Vitamin E
Vit. E
Vitamin B1
Vit. B1
Vitamin B2
Vit. B2
Vitamin B3
Vit. B3
Vitamin B5
Vit. B5
Vitamin B6
Vit. B6
Vitamin B12
Vit. B12
Vitamin K
Vit. K
Folate
Folate
14%
0%
0.33%
2.4%
3%
6%
3%
2.9%
6.7%
0%
11%
5.3%
All nutrients comparison - raw data values
Nutrient
DV% diff.
Manganese
28.408mg
0.048mg
1233%
Iron
11.1mg
0.18mg
137%
Vitamin C
80.8mg
4.3mg
85%
Vitamin B6
1.01mg
0.029mg
75%
Magnesium
264mg
7mg
61%
Potassium
1724mg
116mg
47%
Phosphorus
252mg
12mg
34%
Copper
0.328mg
0.082mg
27%
Protein
11.43g
0.36g
22%
Folate
93µg
7µg
22%
Vitamin B2
0.267mg
0.026mg
19%
Carbs
65.37g
15.23g
17%
Calories
310kcal
57kcal
13%
Polyunsaturated fat
2.067g
0.094g
13%
Calcium
111mg
9mg
10%
Selenium
5.6µg
0.1µg
10%
Fats
5.85g
0.14g
9%
Zinc
1.09mg
0.1mg
9%
Vitamin B1
0.115mg
0.012mg
9%
Vitamin B3
1.46mg
0.161mg
8%
Fructose
6.42g
8%
Saturated fat
1.586g
0.022g
7%
Sodium
148mg
1mg
6%
Vitamin K
4.4µg
4%
Fiber
3.9g
3.1g
3%
Vitamin A
27µg
1µg
3%
Vitamin E
0.12mg
1%
Vitamin B5
0.049mg
1%
Choline
5.1mg
1%
Monounsaturated fat
0.429g
0.084g
1%
Protein per 100 calories
3.7g
0.63g
N/A
Calories per 10 g protein
271kcal
1583kcal
N/A
Weight per 100 calories
32g
175g
N/A
Unsaturated / Saturated Fat ratio
1.6
8.1
N/A
Net carbs
61.47g
12.13g
N/A
Sugar
9.75g
N/A
Tryptophan
0.002mg
0%
Threonine
0.011mg
0%
Isoleucine
0.011mg
0%
Leucine
0.019mg
0%
Lysine
0.017mg
0%
Methionine
0.002mg
0%
Phenylalanine
0.011mg
0%
Valine
0.017mg
0%
Histidine
0.002mg
0%
Omega-3 - DPA
0.006g
0g
N/A
Macronutrient Comparison
Macronutrient breakdown side-by-side comparison
4
11%
6%
65%
12%
5%
Protein:
11.43 g
Fats:
5.85 g
Carbs:
65.37 g
Water:
11.9 g
Other:
5.45 g
1
15%
84%
Protein:
0.36 g
Fats:
0.14 g
Carbs:
15.23 g
Water:
83.96 g
Other:
0.31 g
Contains
more
Protein Protein
+3075%
Contains
more
Fats Fats
+4078.6%
Contains
more
Carbs Carbs
+329.2%
Contains
more
Other Other
+1658.1%
Contains
more
Water Water
+605.5%
Fat Type Comparison
Fat type breakdown side-by-side comparison
2
39%
11%
51%
Saturated fat:
Sat. Fat
1.586 g
Monounsaturated fat:
Mono. Fat
0.429 g
Polyunsaturated fat:
Poly. Fat
2.067 g
1
11%
42%
47%
Saturated fat:
Sat. Fat
0.022 g
Monounsaturated fat:
Mono. Fat
0.084 g
Polyunsaturated fat:
Poly. Fat
0.094 g
Contains
more
Mono. Fat Monounsaturated fat
+410.7%
Contains
more
Poly. Fat Polyunsaturated fat
+2098.9%
Contains
less
Sat. Fat Saturated fat
-98.6%