Sake vs. Rum — In-Depth Nutrition Comparison
Compare
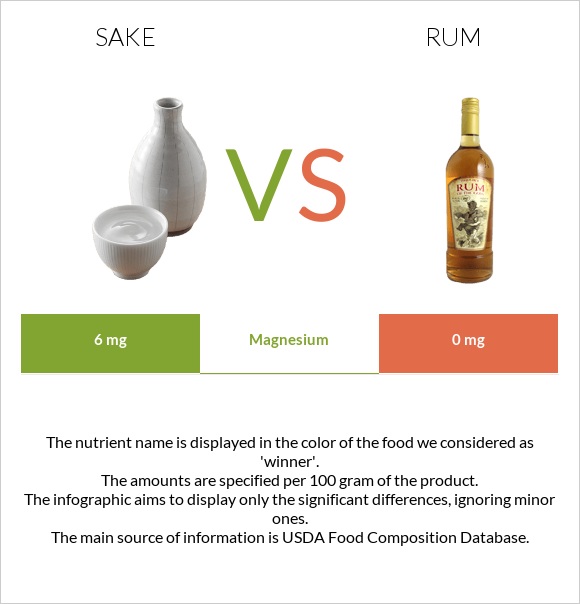
How are sake and rum different?
Alcoholic beverage, rice (sake) and Alcoholic beverage, distilled, rum, 80 proof are the varieties used in this article.
Infographic
Infographic link
Mineral Comparison
Mineral comparison score is based on the number of minerals by which one or the other food is richer. The "coverage" charts below show how much of the daily needs can be covered by 300 grams of the food.
| Contains more MagnesiumMagnesium | +∞% |
| Contains more CalciumCalcium | +∞% |
| Contains more PotassiumPotassium | +1150% |
| Contains more PhosphorusPhosphorus | +20% |
| Contains more SeleniumSelenium | +∞% |
| Contains more IronIron | +20% |
| Contains more CopperCopper | +455.6% |
| Contains more ZincZinc | +250% |
| Contains less SodiumSodium | -50% |
Vitamin Comparison
Vitamin comparison score is based on the number of vitamins by which one or the other food is richer. The "coverage" charts below show how much of the daily needs can be covered by 300 grams of the food.
| Contains more Vitamin B1Vitamin B1 | +∞% |
All nutrients comparison - raw data values
| Nutrient |  |
 |
DV% diff. |
| Calories | 134kcal | 231kcal | 5% |
| Copper | 0.009mg | 0.05mg | 5% |
| Selenium | 1.4µg | 0µg | 3% |
| Carbs | 5g | 0g | 2% |
| Protein | 0.5g | 0g | 1% |
| Magnesium | 6mg | 0mg | 1% |
| Calcium | 5mg | 0mg | 1% |
| Potassium | 25mg | 2mg | 1% |
| Manganese | 0.018mg | 1% | |
| Vitamin B1 | 0mg | 0.008mg | 1% |
| Net carbs | 5g | 0g | N/A |
| Iron | 0.1mg | 0.12mg | 0% |
| Zinc | 0.02mg | 0.07mg | 0% |
| Phosphorus | 6mg | 5mg | 0% |
| Sodium | 2mg | 1mg | 0% |
Macronutrient Comparison
Macronutrient breakdown side-by-side comparison
| Contains more ProteinProtein | +∞% |
| Contains more CarbsCarbs | +∞% |
| Contains more WaterWater | +17.7% |
| Contains more OtherOther | +107.5% |
~equal in
Fats
~0g


