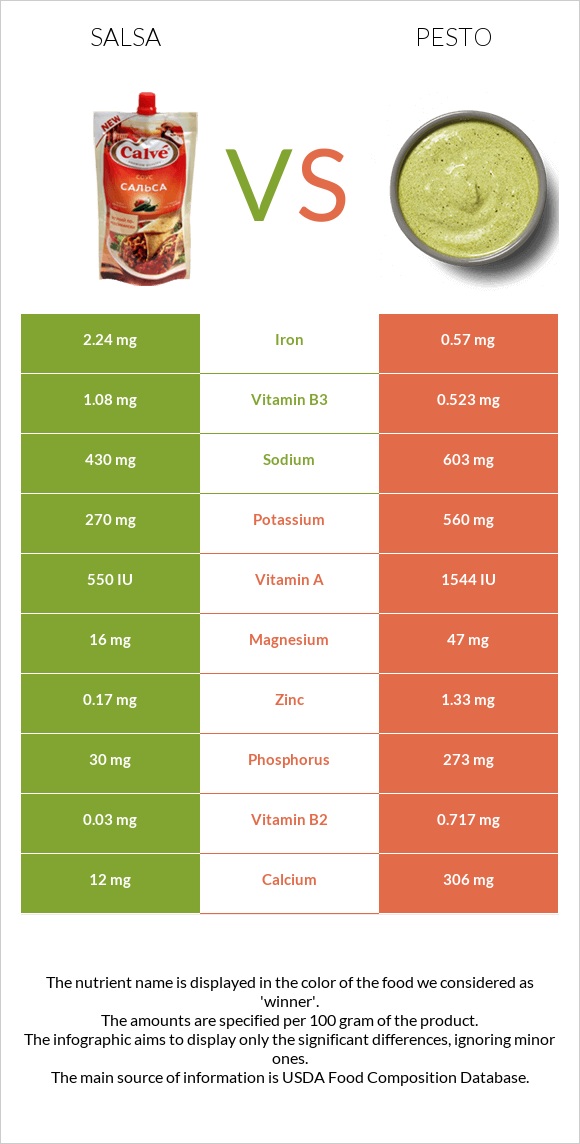
The main differences between salsa and pesto Salsa is richer in iron, yet pesto is richer in vitamin B2, phosphorus, calcium, vitamin A, zinc, vitamin B1, and potassium. Daily need coverage for vitamin B2 for pesto is 53% higher. Salsa contains 4 times more iron than pesto. Salsa contains 2.24mg of iron, while pesto contains 0.57mg. Salsa contains less sodium. Food types used in this article are USDA Commodity, salsa and Sauce, pesto, ready-to-serve, refrigerated .
Infographic
Mineral Comparison
Mineral comparison score is based on the number of minerals by which one or the other food is richer. The "coverage" charts below show how much of the daily needs can be covered by 300 grams of the food.
4
100 g
300 g
Magnesium
Magnesium
Calcium
Calcium
Potassium
Potassium
Iron
Iron
Copper
Copper
Zinc
Zinc
Phosphorus
Phosphorus
Sodium
Sodium
Manganese
Manganese
Selenium
Selenium
11%
3.6%
24%
84%
32%
4.6%
13%
56%
0%
2.2%
6
100 g
300 g
0.25 cup - 63g
Magnesium
Magnesium
Calcium
Calcium
Potassium
Potassium
Iron
Iron
Copper
Copper
Zinc
Zinc
Phosphorus
Phosphorus
Sodium
Sodium
Manganese
Manganese
Selenium
Selenium
34%
92%
49%
21%
27%
36%
117%
79%
76%
0%
Vitamin Comparison
Vitamin comparison score is based on the number of vitamins by which one or the other food is richer. The "coverage" charts below show how much of the daily needs can be covered by 300 grams of the food.
4
100 g
300 g
Vitamin C
Vit. C
Vitamin D
Vit. D
Vitamin A
Vit. A
Vitamin E
Vit. E
Vitamin B1
Vit. B1
Vitamin B2
Vit. B2
Vitamin B3
Vit. B3
Vitamin B5
Vit. B5
Vitamin B6
Vit. B6
Vitamin B12
Vit. B12
Vitamin K
Vit. K
Folate
Folate
13%
0%
9.3%
0%
13%
6.9%
20%
0%
34%
0%
0%
14%
6
100 g
300 g
0.25 cup - 63g
Vitamin C
Vit. C
Vitamin D
Vit. D
Vitamin A
Vit. A
Vitamin E
Vit. E
Vitamin B1
Vit. B1
Vitamin B2
Vit. B2
Vitamin B3
Vit. B3
Vitamin B5
Vit. B5
Vitamin B6
Vit. B6
Vitamin B12
Vit. B12
Vitamin K
Vit. K
Folate
Folate
0%
0%
26%
145%
43%
165%
9.8%
102%
31%
0%
378%
12%
All nutrients comparison - raw data values
Nutrient
DV% diff.
Vitamin K
151.1µg
126%
Fats
0.2g
37.6g
58%
Monounsaturated fat
0.016g
22.155g
55%
Vitamin B2
0.03mg
0.717mg
53%
Vitamin E
7.27mg
48%
Polyunsaturated fat
0.107g
6.546g
43%
Phosphorus
30mg
273mg
35%
Vitamin B5
1.7mg
34%
Saturated fat
0.029g
7.07g
32%
Calcium
12mg
306mg
29%
Manganese
0.586mg
25%
Iron
2.24mg
0.57mg
21%
Calories
36kcal
418kcal
19%
Protein
1.5g
9.83g
17%
Zinc
0.17mg
1.33mg
11%
Vitamin B1
0.05mg
0.17mg
10%
Potassium
270mg
560mg
9%
Sodium
430mg
603mg
8%
Magnesium
16mg
47mg
7%
Vitamin A
28µg
77µg
5%
Vitamin C
4mg
0mg
4%
Vitamin B3
1.08mg
0.523mg
3%
Fiber
1.4g
1.8g
2%
Copper
0.096mg
0.08mg
2%
Carbs
7g
10.09g
1%
Starch
2.2g
1%
Selenium
0.4µg
1%
Vitamin B6
0.149mg
0.133mg
1%
Folate
19µg
16µg
1%
Protein per 100 calories
4.2g
2.4g
N/A
Calories per 10 g protein
240kcal
425kcal
N/A
Weight per 100 calories
278g
24g
N/A
Unsaturated / Saturated Fat ratio
4.2
4.1
N/A
Net carbs
5.6g
8.29g
N/A
Sugar
6.33g
N/A
Trans fat
0.398g
N/A
Omega-3 - EPA
0g
0.002g
N/A
Omega-3 - ALA
1.268g
N/A
Omega-3 - DPA
0g
0.004g
N/A
Omega-3 - Eicosatrienoic acid
0.002g
N/A
Omega-6 - Gamma-linoleic acid
0.058g
N/A
Omega-6 - Dihomo-gamma-linoleic acid
0.007g
N/A
Omega-6 - Eicosadienoic acid
0.021g
N/A
Omega-6 - Linoleic acid
4.783g
N/A
Macronutrient Comparison
Macronutrient breakdown side-by-side comparison
1
7%
90%
Protein:
1.5 g
Fats:
0.2 g
Carbs:
7 g
Water:
89.7 g
Other:
1.6 g
4
10%
38%
10%
39%
4%
Protein:
9.83 g
Fats:
37.6 g
Carbs:
10.09 g
Water:
38.98 g
Other:
3.5 g
Contains
more
Water Water
+130.1%
Contains
more
Protein Protein
+555.3%
Contains
more
Fats Fats
+18700%
Contains
more
Carbs Carbs
+44.1%
Contains
more
Other Other
+118.8%
Fat Type Comparison
Fat type breakdown side-by-side comparison
1
19%
11%
70%
Saturated fat:
Sat. Fat
0.029 g
Monounsaturated fat:
Mono. Fat
0.016 g
Polyunsaturated fat:
Poly. Fat
0.107 g
2
20%
62%
18%
Saturated fat:
Sat. Fat
7.07 g
Monounsaturated fat:
Mono. Fat
22.155 g
Polyunsaturated fat:
Poly. Fat
6.546 g
Contains
less
Sat. Fat Saturated fat
-99.6%
Contains
more
Mono. Fat Monounsaturated fat
+138368.8%
Contains
more
Poly. Fat Polyunsaturated fat
+6017.8%