How are pesto and soy sauce different? Pesto is higher in vitamin K, vitamin E, vitamin B2, vitamin A, vitamin B5, calcium, and phosphorus; however, soy sauce is richer in manganese. Daily need coverage for sodium for soy sauce is 213% higher. Soy sauce has less saturated fat. Sauce, pesto, ready-to-serve, refrigerated and Soy sauce made from soy and wheat (shoyu) are the varieties used in this article.
Infographic
Mineral Comparison
Mineral comparison score is based on the number of minerals by which one or the other food is richer. The "coverage" charts below show how much of the daily needs can be covered by 300 grams of the food.
6
100 g
300 g
0.25 cup - 63g
Magnesium
Magnesium
Calcium
Calcium
Potassium
Potassium
Iron
Iron
Copper
Copper
Zinc
Zinc
Phosphorus
Phosphorus
Sodium
Sodium
Manganese
Manganese
Selenium
Selenium
34%
92%
49%
21%
27%
36%
117%
79%
76%
0%
4
100 g
300 g
1 tsp - 5.3g 1 individual packet - 8.9g 1 tbsp - 16g 1 cup - 255g
Magnesium
Magnesium
Calcium
Calcium
Potassium
Potassium
Iron
Iron
Copper
Copper
Zinc
Zinc
Phosphorus
Phosphorus
Sodium
Sodium
Manganese
Manganese
Selenium
Selenium
53%
9.9%
38%
54%
14%
24%
71%
716%
133%
2.7%
Vitamin Comparison
Vitamin comparison score is based on the number of vitamins by which one or the other food is richer. The "coverage" charts below show how much of the daily needs can be covered by 300 grams of the food.
7
100 g
300 g
0.25 cup - 63g
Vitamin C
Vit. C
Vitamin D
Vit. D
Vitamin A
Vit. A
Vitamin E
Vit. E
Vitamin B1
Vit. B1
Vitamin B2
Vit. B2
Vitamin B3
Vit. B3
Vitamin B5
Vit. B5
Vitamin B6
Vit. B6
Vitamin B12
Vit. B12
Vitamin K
Vit. K
Folate
Folate
0%
0%
26%
145%
43%
165%
9.8%
102%
31%
0%
378%
12%
2
100 g
300 g
1 tsp - 5.3g 1 individual packet - 8.9g 1 tbsp - 16g 1 cup - 255g
Vitamin C
Vit. C
Vitamin D
Vit. D
Vitamin A
Vit. A
Vitamin E
Vit. E
Vitamin B1
Vit. B1
Vitamin B2
Vit. B2
Vitamin B3
Vit. B3
Vitamin B5
Vit. B5
Vitamin B6
Vit. B6
Vitamin B12
Vit. B12
Vitamin K
Vit. K
Folate
Folate
0%
0%
0%
0%
8.3%
38%
41%
18%
34%
0%
0%
11%
All nutrients comparison - raw data values
Nutrient
DV% diff.
Sodium
603mg
5493mg
213%
Vitamin K
151.1µg
0µg
126%
Fats
37.6g
0.57g
57%
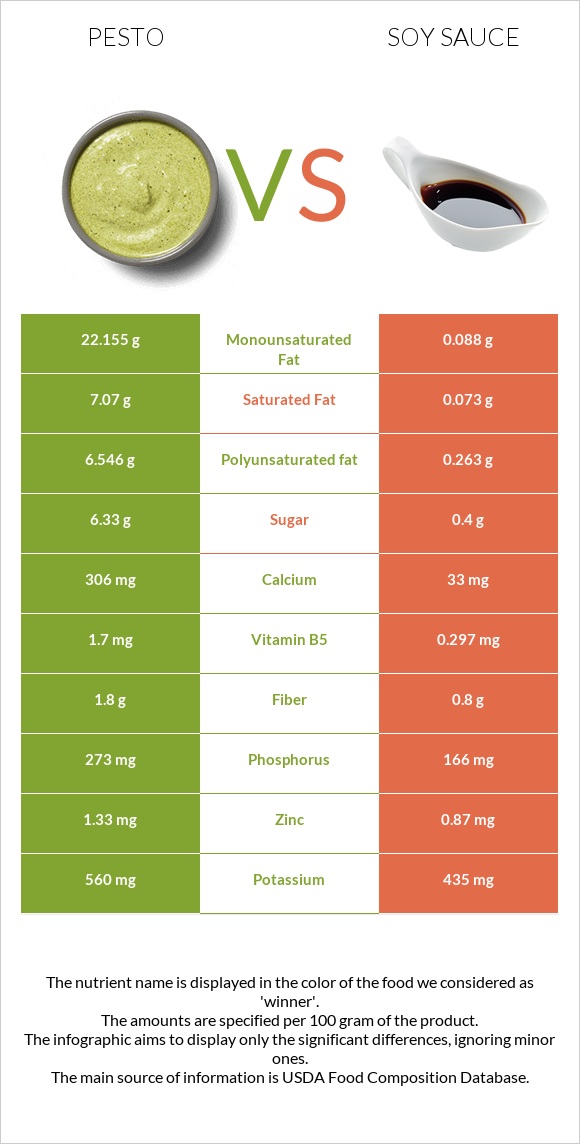
Monounsaturated fat
22.155g
0.088g
55%
Vitamin E
7.27mg
0mg
48%
Vitamin B2
0.717mg
0.165mg
42%
Polyunsaturated fat
6.546g
0.263g
42%
Saturated fat
7.07g
0.073g
32%
Vitamin B5
1.7mg
0.297mg
28%
Calcium
306mg
33mg
27%
Manganese
0.586mg
1.018mg
19%
Calories
418kcal
53kcal
18%
Phosphorus
273mg
166mg
15%
Iron
0.57mg
1.45mg
11%
Vitamin B1
0.17mg
0.033mg
11%
Vitamin B3
0.523mg
2.196mg
10%
Vitamin A
77µg
0µg
9%
Magnesium
47mg
74mg
6%
Potassium
560mg
435mg
4%
Fiber
1.8g
0.8g
4%
Copper
0.08mg
0.043mg
4%
Zinc
1.33mg
0.87mg
4%
Protein
9.83g
8.14g
3%
Choline
18.3mg
3%
Carbs
10.09g
4.93g
2%
Starch
2.2g
1%
Selenium
0.5µg
1%
Vitamin B6
0.133mg
0.148mg
1%
Folate
16µg
14µg
1%
Protein per 100 calories
2.4g
15g
N/A
Calories per 10 g protein
425kcal
65kcal
N/A
Weight per 100 calories
24g
189g
N/A
Unsaturated / Saturated Fat ratio
4.1
4.8
N/A
Net carbs
8.29g
4.13g
N/A
Sugar
6.33g
0.4g
N/A
Trans fat
0.398g
0g
N/A
Tryptophan
0.096mg
0%
Threonine
0.271mg
0%
Isoleucine
0.318mg
0%
Leucine
0.537mg
0%
Lysine
0.381mg
0%
Methionine
0.097mg
0%
Phenylalanine
0.353mg
0%
Valine
0.332mg
0%
Histidine
0.174mg
0%
Omega-3 - EPA
0.002g
0g
N/A
Omega-3 - ALA
1.268g
N/A
Omega-3 - DPA
0.004g
0g
N/A
Omega-3 - Eicosatrienoic acid
0.002g
N/A
Omega-6 - Gamma-linoleic acid
0.058g
N/A
Omega-6 - Dihomo-gamma-linoleic acid
0.007g
N/A
Omega-6 - Eicosadienoic acid
0.021g
N/A
Omega-6 - Linoleic acid
4.783g
N/A
Macronutrient Comparison
Macronutrient breakdown side-by-side comparison
3
10%
38%
10%
39%
4%
Protein:
9.83 g
Fats:
37.6 g
Carbs:
10.09 g
Water:
38.98 g
Other:
3.5 g
2
8%
5%
71%
15%
Protein:
8.14 g
Fats:
0.57 g
Carbs:
4.93 g
Water:
71.15 g
Other:
15.21 g
Contains
more
Protein Protein
+20.8%
Contains
more
Fats Fats
+6496.5%
Contains
more
Carbs Carbs
+104.7%
Contains
more
Water Water
+82.5%
Contains
more
Other Other
+334.6%
Fat Type Comparison
Fat type breakdown side-by-side comparison
2
20%
62%
18%
Saturated fat:
Sat. Fat
7.07 g
Monounsaturated fat:
Mono. Fat
22.155 g
Polyunsaturated fat:
Poly. Fat
6.546 g
1
17%
21%
62%
Saturated fat:
Sat. Fat
0.073 g
Monounsaturated fat:
Mono. Fat
0.088 g
Polyunsaturated fat:
Poly. Fat
0.263 g
Contains
more
Mono. Fat Monounsaturated fat
+25076.1%
Contains
more
Poly. Fat Polyunsaturated fat
+2389%
Contains
less
Sat. Fat Saturated fat
-99%
Carbohydrate type comparison
Carbohydrate type breakdown side-by-side comparison
3
26%
3%
70%
2%
Starch:
2.2 g
Sucrose:
0 g
Glucose:
0.23 g
Fructose:
0 g
Lactose:
5.94 g
Maltose:
0 g
Galactose:
0.15 g
2
25%
75%
Starch:
0 g
Sucrose:
0.1 g
Glucose:
0.3 g
Fructose:
0 g
Lactose:
0 g
Maltose:
0 g
Galactose:
0 g
Contains
more
Starch Starch
+∞%
Contains
more
Lactose Lactose
+∞%
Contains
more
Galactose Galactose
+∞%
Contains
more
Sucrose Sucrose
+∞%
Contains
more
Glucose Glucose
+30.4%
~equal in
Fructose
~0g
~equal in
Maltose
~0g