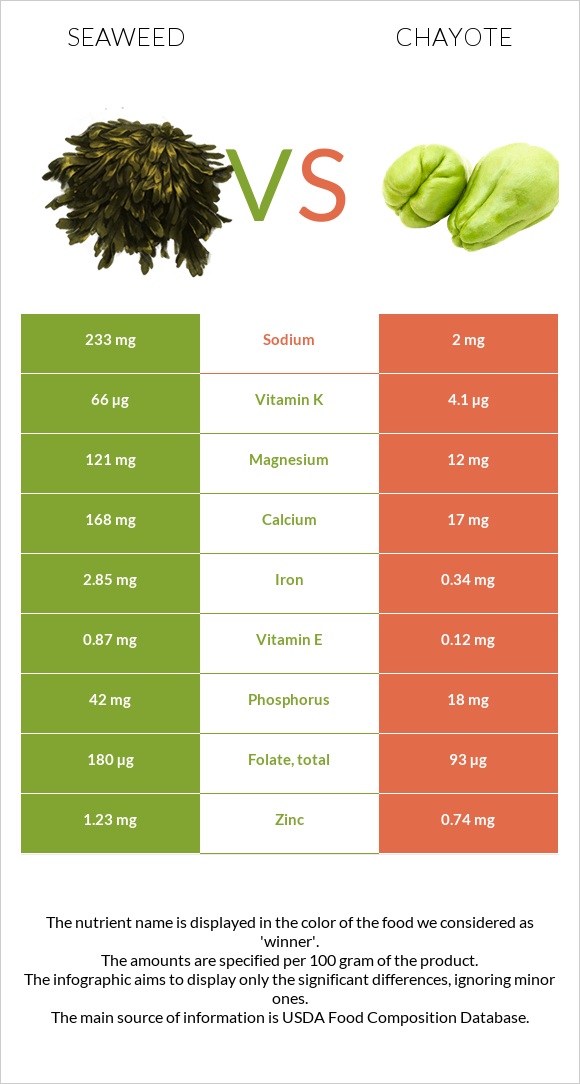
The main differences between seaweed and chayote Seaweed is richer in vitamin K, iron, magnesium, folate, calcium, vitamin B2, and vitamin B5, yet chayote is richer in vitamin B6 and vitamin C. Daily need coverage for vitamin K for seaweed is 52% higher. Seaweed contains 117 times more sodium than chayote. Seaweed contains 233mg of sodium, while chayote contains 2mg. Food types used in this article are Seaweed, kelp, raw and Chayote, fruit, raw .
Infographic
Mineral Comparison
Mineral comparison score is based on the number of minerals by which one or the other food is richer. The "coverage" charts below show how much of the daily needs can be covered by 300 grams of the food.
6
100 g
300 g
2 tbsp (1/8 cup) - 10g
Magnesium
Magnesium
Calcium
Calcium
Potassium
Potassium
Iron
Iron
Copper
Copper
Zinc
Zinc
Phosphorus
Phosphorus
Sodium
Sodium
Manganese
Manganese
Selenium
Selenium
86%
50%
7.9%
107%
43%
34%
18%
30%
26%
3.8%
2
100 g
300 g
1 cup (1" pieces) - 132g 1 chayote (5-3/4") - 203g
Magnesium
Magnesium
Calcium
Calcium
Potassium
Potassium
Iron
Iron
Copper
Copper
Zinc
Zinc
Phosphorus
Phosphorus
Sodium
Sodium
Manganese
Manganese
Selenium
Selenium
8.6%
5.1%
11%
13%
41%
20%
7.7%
0.26%
25%
1.1%
Vitamin Comparison
Vitamin comparison score is based on the number of vitamins by which one or the other food is richer. The "coverage" charts below show how much of the daily needs can be covered by 300 grams of the food.
7
100 g
300 g
2 tbsp (1/8 cup) - 10g
Vitamin C
Vit. C
Vitamin D
Vit. D
Vitamin A
Vit. A
Vitamin E
Vit. E
Vitamin B1
Vit. B1
Vitamin B2
Vit. B2
Vitamin B3
Vit. B3
Vitamin B5
Vit. B5
Vitamin B6
Vit. B6
Vitamin B12
Vit. B12
Vitamin K
Vit. K
Folate
Folate
10%
0%
2%
17%
13%
35%
8.8%
39%
0.46%
0%
165%
135%
2
100 g
300 g
1 cup (1" pieces) - 132g 1 chayote (5-3/4") - 203g
Vitamin C
Vit. C
Vitamin D
Vit. D
Vitamin A
Vit. A
Vitamin E
Vit. E
Vitamin B1
Vit. B1
Vitamin B2
Vit. B2
Vitamin B3
Vit. B3
Vitamin B5
Vit. B5
Vitamin B6
Vit. B6
Vitamin B12
Vit. B12
Vitamin K
Vit. K
Folate
Folate
26%
0%
0%
2.4%
6.3%
6.7%
8.8%
15%
18%
0%
10%
70%
All nutrients comparison - raw data values
Nutrient
DV% diff.
Vitamin K
66µg
4.1µg
52%
Iron
2.85mg
0.34mg
31%
Magnesium
121mg
12mg
26%
Folate
180µg
93µg
22%
Calcium
168mg
17mg
15%
Sodium
233mg
2mg
10%
Vitamin B2
0.15mg
0.029mg
9%
Vitamin B5
0.642mg
0.249mg
8%
Vitamin B6
0.002mg
0.076mg
6%
Vitamin C
3mg
7.7mg
5%
Vitamin E
0.87mg
0.12mg
5%
Zinc
1.23mg
0.74mg
4%
Phosphorus
42mg
18mg
3%
Protein
1.68g
0.82g
2%
Carbs
9.57g
4.51g
2%
Fiber
1.3g
1.7g
2%
Vitamin B1
0.05mg
0.025mg
2%
Calories
43kcal
19kcal
1%
Fats
0.56g
0.13g
1%
Potassium
89mg
125mg
1%
Copper
0.13mg
0.123mg
1%
Vitamin A
6µg
0µg
1%
Selenium
0.7µg
0.2µg
1%
Choline
12.8mg
9.2mg
1%
Saturated fat
0.247g
0.028g
1%
Protein per 100 calories
3.9g
4.3g
N/A
Calories per 10 g protein
256kcal
232kcal
N/A
Weight per 100 calories
233g
526g
N/A
Net carbs
8.27g
2.81g
N/A
Sugar
0.6g
1.66g
N/A
Manganese
0.2mg
0.189mg
0%
Vitamin B3
0.47mg
0.47mg
0%
Monounsaturated fat
0.098g
0.01g
0%
Polyunsaturated fat
0.047g
0.057g
0%
Tryptophan
0.048mg
0.011mg
0%
Threonine
0.055mg
0.04mg
0%
Isoleucine
0.076mg
0.044mg
0%
Leucine
0.083mg
0.077mg
0%
Lysine
0.082mg
0.039mg
0%
Methionine
0.025mg
0.001mg
0%
Phenylalanine
0.043mg
0.047mg
0%
Valine
0.072mg
0.063mg
0%
Histidine
0.024mg
0.015mg
0%
Omega-3 - EPA
0.004g
0g
N/A
Macronutrient Comparison
Macronutrient breakdown side-by-side comparison
4
2%
10%
82%
7%
Protein:
1.68 g
Fats:
0.56 g
Carbs:
9.57 g
Water:
81.58 g
Other:
6.61 g
1
5%
94%
Protein:
0.82 g
Fats:
0.13 g
Carbs:
4.51 g
Water:
94.24 g
Other:
0.3 g
Contains
more
Protein Protein
+104.9%
Contains
more
Fats Fats
+330.8%
Contains
more
Carbs Carbs
+112.2%
Contains
more
Other Other
+2103.3%
Contains
more
Water Water
+15.5%
Fat Type Comparison
Fat type breakdown side-by-side comparison
1
63%
25%
12%
Saturated fat:
Sat. Fat
0.247 g
Monounsaturated fat:
Mono. Fat
0.098 g
Polyunsaturated fat:
Poly. Fat
0.047 g
2
29%
11%
60%
Saturated fat:
Sat. Fat
0.028 g
Monounsaturated fat:
Mono. Fat
0.01 g
Polyunsaturated fat:
Poly. Fat
0.057 g
Contains
more
Mono. Fat Monounsaturated fat
+880%
Contains
less
Sat. Fat Saturated fat
-88.7%
Contains
more
Poly. Fat Polyunsaturated fat
+21.3%