Chayote nutrition: calories, carbs, GI, protein, fiber, fats
Carbs in chayote
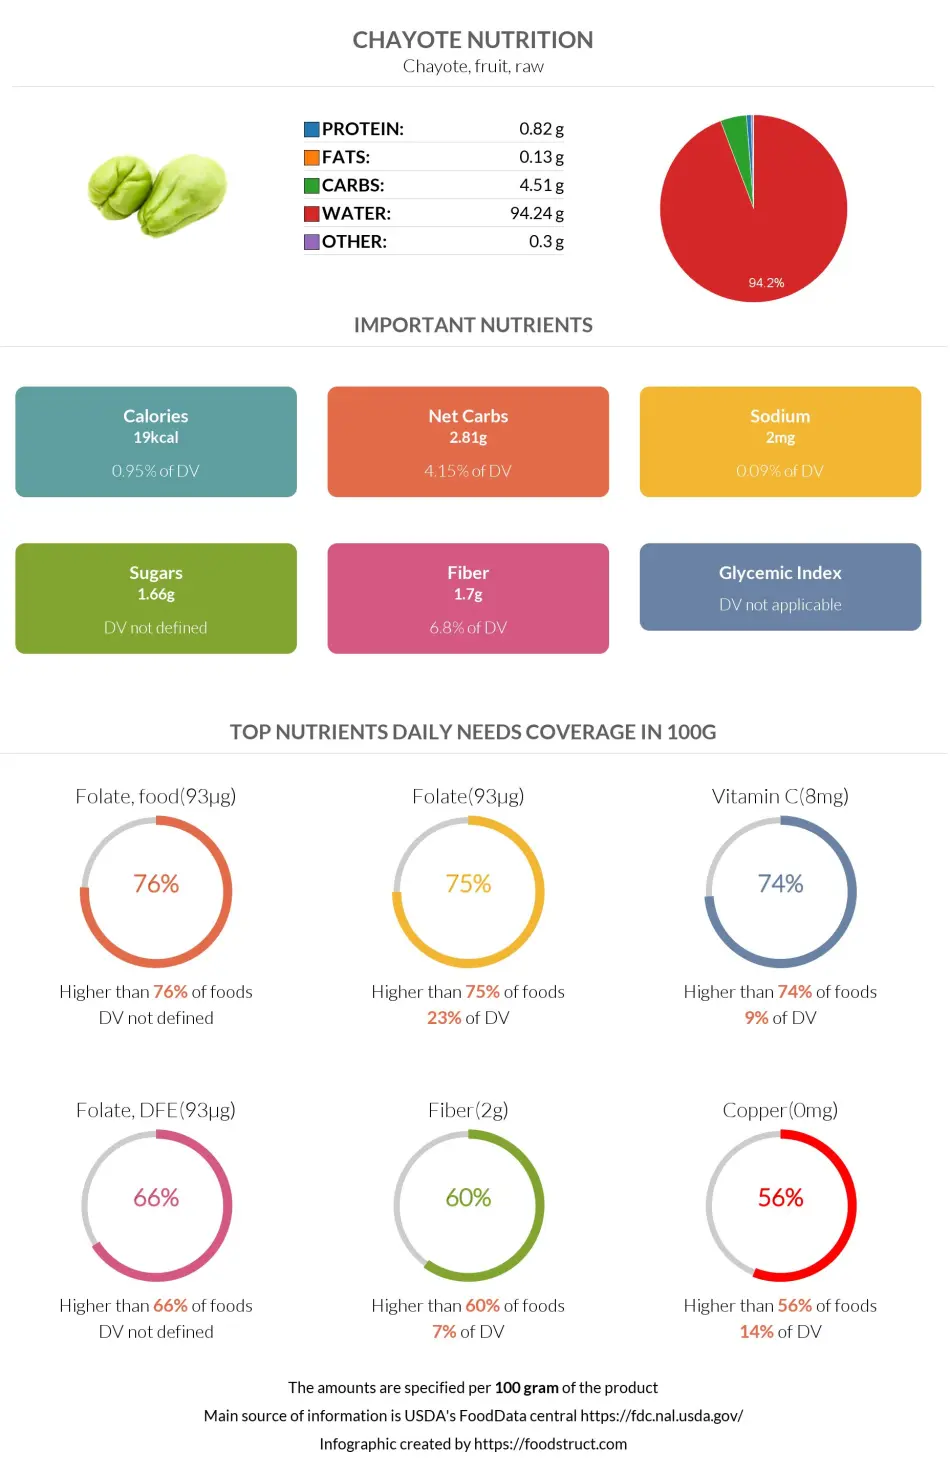
Chayote is 92% water and 8% nutrients, primarily carbs. One hundred grams of chayote contains 4.51g of carbs, which covers only 2% of the daily need (in the case of a 2000-calorie diet).
Macronutrients chart
Carbs per serving size
The average serving size of chayote is 1 cup, weighing 132g. One serving of chayote contains 5.95g of carbs.
One chayote weighing 203g contains 9.16g of carbs.
Chayote net carbs
62.3% (2.81g) of chayote carbs are net carbs, while the remaining 37.7% (1.7g) is dietary fiber. Chayote is low in carbs; therefore, it fits well in low-carb diets such as keto.
Fiber content ratio for Chayote
Chayote Calories
Calories per 100g
Chayote is very low in calories. One hundred grams of chayote provides 19 calories, most of which are provided by carbs.
Calories per serving size
One serving of chayote (1 cup, weighing 132g) provides 25.1 calories.
One chayote (203g) provides 38.6 calories.
Comparison
Compared to all foods in our database, chayote is in the top 3% of foods low in calories.
Along with the foods below, chayote is more frequently compared to potatoes. One hundred grams of boiled chayote and boiled potatoes provide 24 and 87 calories, respectively. While having similar levels of protein and fats, potatoes contain almost four times more carbs.
Summary table & burning estimates
We have calculated the duration and number of calories a person will burn by performing a certain type of activity, measured by a method called Met or Metabolic Equivalent of a Task (1, 2).
The table below shows the time and type of activity a person should perform to burn 25.1 calories from one cup of chayote.
| 60kg person | 80kg person | 100kg person | |
| Walking | 7.5 min | 5.5 min | 4.5 min |
| Running | 2.5 min | 2 min | 1.5 min |
| Cycling | 3.5 min | 2.5 min | 2 min |
| Aerobics | 3.5 min | 3 min | 2.5 min |
References

Top nutrition facts for Chayote
| Calories ⓘ Calories for selected serving | 19 kcal |
| Glycemic load ⓘ Glycemic Load (GL) is a metric that measures both the quality (Glycemic Index) and quantity of carbohydrates in a specific serving of food to estimate its impact on blood sugar levels. It is calculated as: (GI × Carbs in grams) / 100. | 0 (low) |
| Net carbs ⓘ Net Carbs = Total Carbohydrates – Fiber – Sugar Alcohols | 3 g |
| Default serving size ⓘ Serving sizes are mostly taken from FDA's Reference Amounts Customarily Consumed (RACCs) | 1 cup (1" pieces) (132 g) |
| Acidity (Based on PRAL) ⓘ PRAL (Potential renal acid load) is calculated using a formula. On the PRAL scale the higher the positive value, the more is the acidifying effect on the body. The lower the negative value, the higher the alkalinity of the food. 0 is neutral. | -2.1 (alkaline) |
Chayote calories (kcal)
| Calories for different serving sizes of chayote | Calories | Weight |
|---|---|---|
| Calories in 100 grams | 19 |
| Calories for different varieties of chayote | Calories | Weight |
|---|---|---|
| Chayote, fruit, raw (this food) | 19 | 100 g |
| Chayote, fruit, cooked, boiled, drained, with salt | 22 | 100 g |
| Chayote, fruit, cooked, boiled, drained, without salt | 24 | 100 g |
Extra Nutrition facts for Chayote
| Protein per 100 calories ⓘ Shows how many grams of protein you get from 100 calories of this food, calculated as (protein in g ÷ calories) × 100. | 4.3 g |
| Calories per 10 g protein ⓘ Shows how many calories you need to eat from this food to get 10 g of protein, calculated as (calories ÷ protein in g) × 10. | 232 kcal |
| Weight per 100 calories ⓘ Shows how many grams of this food equal 100 kcal—higher grams mean a larger portion for the same calories. | 526 g |
Mineral coverage chart
Mineral chart - relative view
Vitamin coverage chart
Vitamin chart - relative view
Protein quality breakdown
Fat type information
All nutrients for Chayote per 100g
| Nutrient | Value | DV% | In TOP % of foods | Comparison |
| Vitamin A | 0µg | 0% | 100% | |
| Calories | 19kcal | 1% | 98% |
2.5 times less than Orange
|
| Protein per 100 calories | 4.3g | N/A | 49% | |
| Calories per 10 g protein | 232kcal | N/A | 47% | |
| Weight per 100 calories | 526g | N/A | 3% | |
| Protein | 0.82g | 2% | 87% |
3.4 times less than Broccoli
|
| Fats | 0.13g | 0% | 91% |
256.2 times less than Cheese
|
| Vitamin C | 7.7mg | 9% | 18% |
6.9 times less than Lemon
|
| Carbs | 4.5g | 2% | 62% |
6.2 times less than Rice
|
| Net carbs | 2.8g | N/A | 64% |
19.3 times less than Chocolate
|
| Cholesterol | 0mg | 0% | 100% |
N/A
|
| Vitamin D* | 0 IU | 0% | 100% |
N/A
|
| Vitamin D | 0µg | 0% | 100% |
N/A
|
| Magnesium | 12mg | 3% | 72% |
11.7 times less than Almonds
|
| Calcium | 17mg | 2% | 56% |
7.4 times less than Milk
|
| Potassium | 125mg | 4% | 73% |
1.2 times less than Cucumber
|
| Iron | 0.34mg | 4% | 82% |
7.6 times less than Beef broiled
|
| Sugar | 1.7g | N/A | 41% |
5.4 times less than Coca-Cola
|
| Fiber | 1.7g | 7% | 34% |
1.4 times less than Orange
|
| Copper | 0.12mg | 14% | 30% |
1.2 times less than Shiitake
|
| Zinc | 0.74mg | 7% | 52% |
8.5 times less than Beef broiled
|
| Phosphorus | 18mg | 3% | 83% |
10.1 times less than Chicken meat
|
| Sodium | 2mg | 0% | 95% |
245 times less than White bread
|
| Vitamin E | 0.12mg | 1% | 52% |
12.2 times less than Kiwi
|
| Manganese | 0.19mg | 8% | 28% | |
| Selenium | 0.2µg | 0% | 75% | |
| Vitamin B1 | 0.03mg | 2% | 78% |
10.6 times less than Pea raw
|
| Vitamin B2 | 0.03mg | 2% | 81% |
4.5 times less than Avocado
|
| Vitamin B3 | 0.47mg | 3% | 72% |
20.4 times less than Turkey meat
|
| Vitamin B5 | 0.25mg | 5% | 53% |
4.5 times less than Sunflower seeds
|
| Vitamin B6 | 0.08mg | 6% | 61% |
1.6 times less than Oats
|
| Vitamin B12 | 0µg | 0% | 100% |
N/A
|
| Vitamin K | 4.1µg | 3% | 18% |
24.8 times less than Broccoli
|
| Folate | 93µg | 23% | 11% |
1.5 times more than Brussels sprouts
|
| Trans fat | 0g | N/A | 100% |
N/A
|
| Choline | 9.2mg | 2% | 41% | |
| Saturated fat | 0.03g | 0% | 86% |
210.5 times less than Beef broiled
|
| Monounsaturated fat | 0.01g | N/A | 85% |
979.9 times less than Avocado
|
| Polyunsaturated fat | 0.06g | N/A | 82% |
827.6 times less than Walnut
|
| Tryptophan | 0.01mg | 0% | 54% |
27.7 times less than Chicken meat
|
| Threonine | 0.04mg | 0% | 54% |
18 times less than Beef broiled
|
| Isoleucine | 0.04mg | 0% | 54% |
20.8 times less than Salmon raw
|
| Leucine | 0.08mg | 0% | 53% |
31.6 times less than Tuna Bluefin
|
| Lysine | 0.04mg | 0% | 55% |
11.6 times less than Tofu
|
| Methionine | 0mg | 0% | 58% |
96 times less than Quinoa
|
| Phenylalanine | 0.05mg | 0% | 53% |
14.2 times less than Egg
|
| Valine | 0.06mg | 0% | 53% |
32.2 times less than Soybean raw
|
| Histidine | 0.02mg | 0% | 55% |
49.9 times less than Turkey meat
|
| Caffeine | 0mg | 0% | 100% | |
| Omega-3 - EPA | 0g | N/A | 100% |
N/A
|
| Omega-3 - DHA | 0g | N/A | 100% |
N/A
|
| Omega-3 - DPA | 0g | N/A | 100% |
N/A
|
Check out similar food or compare with current
NUTRITION FACTS LABEL
Serving Size ______________
Health checks
Chayote nutrition infographic
References
All the values for which the sources are not specified explicitly are taken from FDA’s Food Central. The exact link to the food presented on this page can be found below.