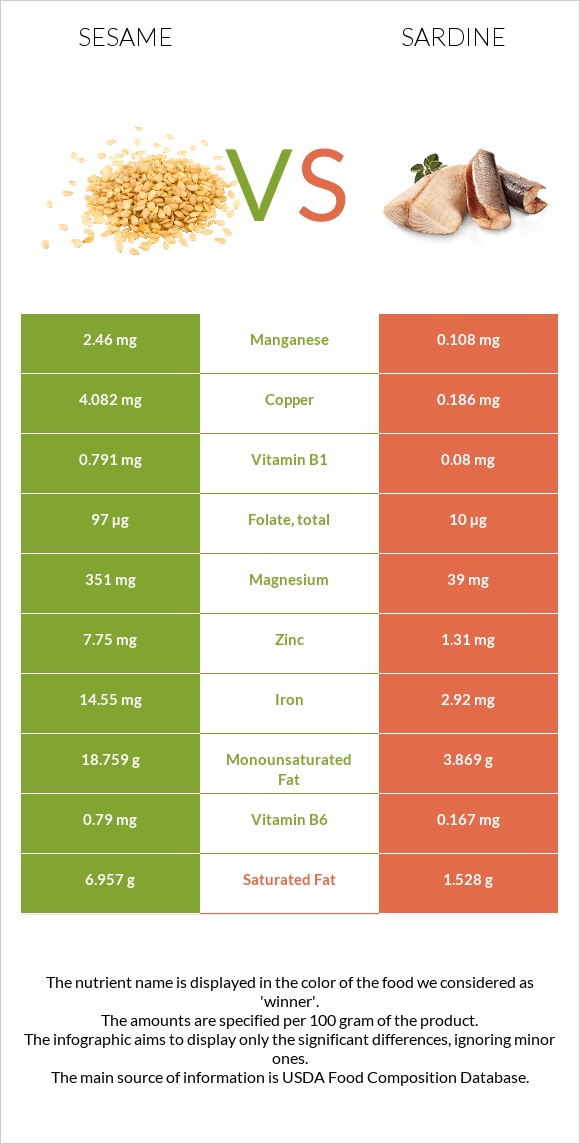
Differences between sesame and sardines Sesame has more copper, iron, manganese, magnesium, calcium, vitamin B1, zinc, and vitamin B6, while sardines have more vitamin B12. Sesame's daily need coverage for copper is 433% higher. Sardines contain 23 times less manganese than sesame. Sesame contains 2.46mg of manganese, while sardines contain 0.108mg. The food types used in this comparison are Seeds, sesame seeds, whole, dried and Fish, sardine, Atlantic, canned in oil, drained solids with bone .
Infographic
Mineral Comparison
Mineral comparison score is based on the number of minerals by which one or the other food is richer. The "coverage" charts below show how much of the daily needs can be covered by 300 grams of the food.
9
100 g
300 g
1 tbsp - 9g 1 cup - 144g
Magnesium
Magnesium
Calcium
Calcium
Potassium
Potassium
Iron
Iron
Copper
Copper
Zinc
Zinc
Phosphorus
Phosphorus
Sodium
Sodium
Manganese
Manganese
Selenium
Selenium
251%
293%
41%
546%
1361%
211%
270%
1.4%
321%
188%
1
100 g
300 g
1 small (2-2/3" x 1/2" x 1/4") - 12g 1 cubic inch - 16g 2 sardines - 24g 1 oz - 28.35g 1 can (3.75 oz) - 92g 1 cup, drained - 149g
Magnesium
Magnesium
Calcium
Calcium
Potassium
Potassium
Iron
Iron
Copper
Copper
Zinc
Zinc
Phosphorus
Phosphorus
Sodium
Sodium
Manganese
Manganese
Selenium
Selenium
28%
115%
35%
110%
62%
36%
210%
40%
14%
287%
Vitamin Comparison
Vitamin comparison score is based on the number of vitamins by which one or the other food is richer. The "coverage" charts below show how much of the daily needs can be covered by 300 grams of the food.
3
100 g
300 g
1 tbsp - 9g 1 cup - 144g
Vitamin C
Vit. C
Vitamin D
Vit. D
Vitamin A
Vit. A
Vitamin E
Vit. E
Vitamin B1
Vit. B1
Vitamin B2
Vit. B2
Vitamin B3
Vit. B3
Vitamin B5
Vit. B5
Vitamin B6
Vit. B6
Vitamin B12
Vit. B12
Vitamin K
Vit. K
Folate
Folate
0%
0%
0%
5%
198%
57%
85%
3%
182%
0%
0%
73%
7
100 g
300 g
1 small (2-2/3" x 1/2" x 1/4") - 12g 1 cubic inch - 16g 2 sardines - 24g 1 oz - 28.35g 1 can (3.75 oz) - 92g 1 cup, drained - 149g
Vitamin C
Vit. C
Vitamin D
Vit. D
Vitamin A
Vit. A
Vitamin E
Vit. E
Vitamin B1
Vit. B1
Vitamin B2
Vit. B2
Vitamin B3
Vit. B3
Vitamin B5
Vit. B5
Vitamin B6
Vit. B6
Vitamin B12
Vit. B12
Vitamin K
Vit. K
Folate
Folate
0%
72%
11%
41%
20%
52%
98%
39%
39%
1118%
6.5%
7.5%
All nutrients comparison - raw data values
Nutrient
DV% diff.
Copper
4.082mg
0.186mg
433%
Vitamin B12
0µg
8.94µg
373%
Iron
14.55mg
2.92mg
145%
Polyunsaturated fat
21.773g
5.148g
111%
Manganese
2.46mg
0.108mg
102%
Magnesium
351mg
39mg
74%
Fats
49.67g
11.45g
59%
Calcium
975mg
382mg
59%
Zinc
7.75mg
1.31mg
59%
Vitamin B1
0.791mg
0.08mg
59%
Vitamin B6
0.79mg
0.167mg
48%
Cholesterol
0mg
142mg
47%
Fiber
11.8g
0g
47%
Monounsaturated fat
18.759g
3.869g
37%
Selenium
34.4µg
52.7µg
33%
Saturated fat
6.957g
1.528g
25%
Vitamin D*
0 IU
193 IU
24%
Vitamin D
0µg
4.8µg
24%
Folate
97µg
10µg
22%
Phosphorus
629mg
490mg
20%
Calories
573kcal
208kcal
18%
Protein
17.73g
24.62g
14%
Sodium
11mg
307mg
13%
Vitamin E
0.25mg
2.04mg
12%
Vitamin B5
0.05mg
0.642mg
12%
Choline
25.6mg
75mg
9%
Carbs
23.45g
0g
8%
Vitamin B3
4.515mg
5.245mg
5%
Vitamin A
0µg
32µg
4%
Potassium
468mg
397mg
2%
Vitamin B2
0.247mg
0.227mg
2%
Vitamin K
0µg
2.6µg
2%
Protein per 100 calories
3.1g
12g
N/A
Calories per 10 g protein
323kcal
84kcal
N/A
Weight per 100 calories
17g
48g
N/A
Unsaturated / Saturated Fat ratio
5.8
5.9
N/A
Net carbs
11.65g
0g
N/A
Sugar
0.3g
0g
N/A
Tryptophan
0.388mg
0.276mg
0%
Threonine
0.736mg
1.079mg
0%
Isoleucine
0.763mg
1.134mg
0%
Leucine
1.358mg
2.001mg
0%
Lysine
0.569mg
2.26mg
0%
Methionine
0.586mg
0.729mg
0%
Phenylalanine
0.94mg
0.961mg
0%
Valine
0.99mg
1.268mg
0%
Histidine
0.522mg
0.725mg
0%
Omega-3 - EPA
0g
0.473g
N/A
Omega-3 - DHA
0g
0.509g
N/A
Macronutrient Comparison
Macronutrient breakdown side-by-side comparison
3
18%
50%
23%
5%
4%
Protein:
17.73 g
Fats:
49.67 g
Carbs:
23.45 g
Water:
4.69 g
Other:
4.46 g
2
25%
11%
60%
4%
Protein:
24.62 g
Fats:
11.45 g
Carbs:
0 g
Water:
59.61 g
Other:
4.32 g
Contains
more
Fats Fats
+333.8%
Contains
more
Carbs Carbs
+∞%
Contains
more
Protein Protein
+38.9%
Contains
more
Water Water
+1171%
Fat Type Comparison
Fat type breakdown side-by-side comparison
2
15%
40%
46%
Saturated fat:
Sat. Fat
6.957 g
Monounsaturated fat:
Mono. Fat
18.759 g
Polyunsaturated fat:
Poly. Fat
21.773 g
1
14%
37%
49%
Saturated fat:
Sat. Fat
1.528 g
Monounsaturated fat:
Mono. Fat
3.869 g
Polyunsaturated fat:
Poly. Fat
5.148 g
Contains
more
Mono. Fat Monounsaturated fat
+384.9%
Contains
more
Poly. Fat Polyunsaturated fat
+322.9%
Contains
less
Sat. Fat Saturated fat
-78%